Eternal Connection
The minting creates the art
Eternal Connection is a long-form, generative art series that celebrates the permanent link that exists between a generative art NFT and the wallet that minted it. To highlight this link, all royalties from secondary sales will go to the minting wallet rather than to the artist, in perpetuity. The series will be available for minting on June 6, 2022, on the fx(hash) platform. All proceeds from primary sales will go to humanitarian relief efforts in Ukraine.
The generative algorithm
Eternal Connection continues my exploration of using t-SNE as a generative algorithm. Compared to earlier collections with somewhat similar appearance, this collection presents several important technical and conceptual advances: It features more variation, more complexity, no pre-defined color palettes (color is now generated algorithmically), and a Javascript + WebAssembly implementation that runs live in the browser. (The earlier collections were written in R and relied on external C++ code to run t-SNE.)
One core concept of this series is the idea of a panel progression. Nearly all iterations consist of a grid of panels that show variations of the same theme. This is an attempt to capture some of the variation of a long-form generative art series within each individual artwork, as each artwork contains multiple outputs from the same algorithm. The series has three distinct approaches to panel progression.
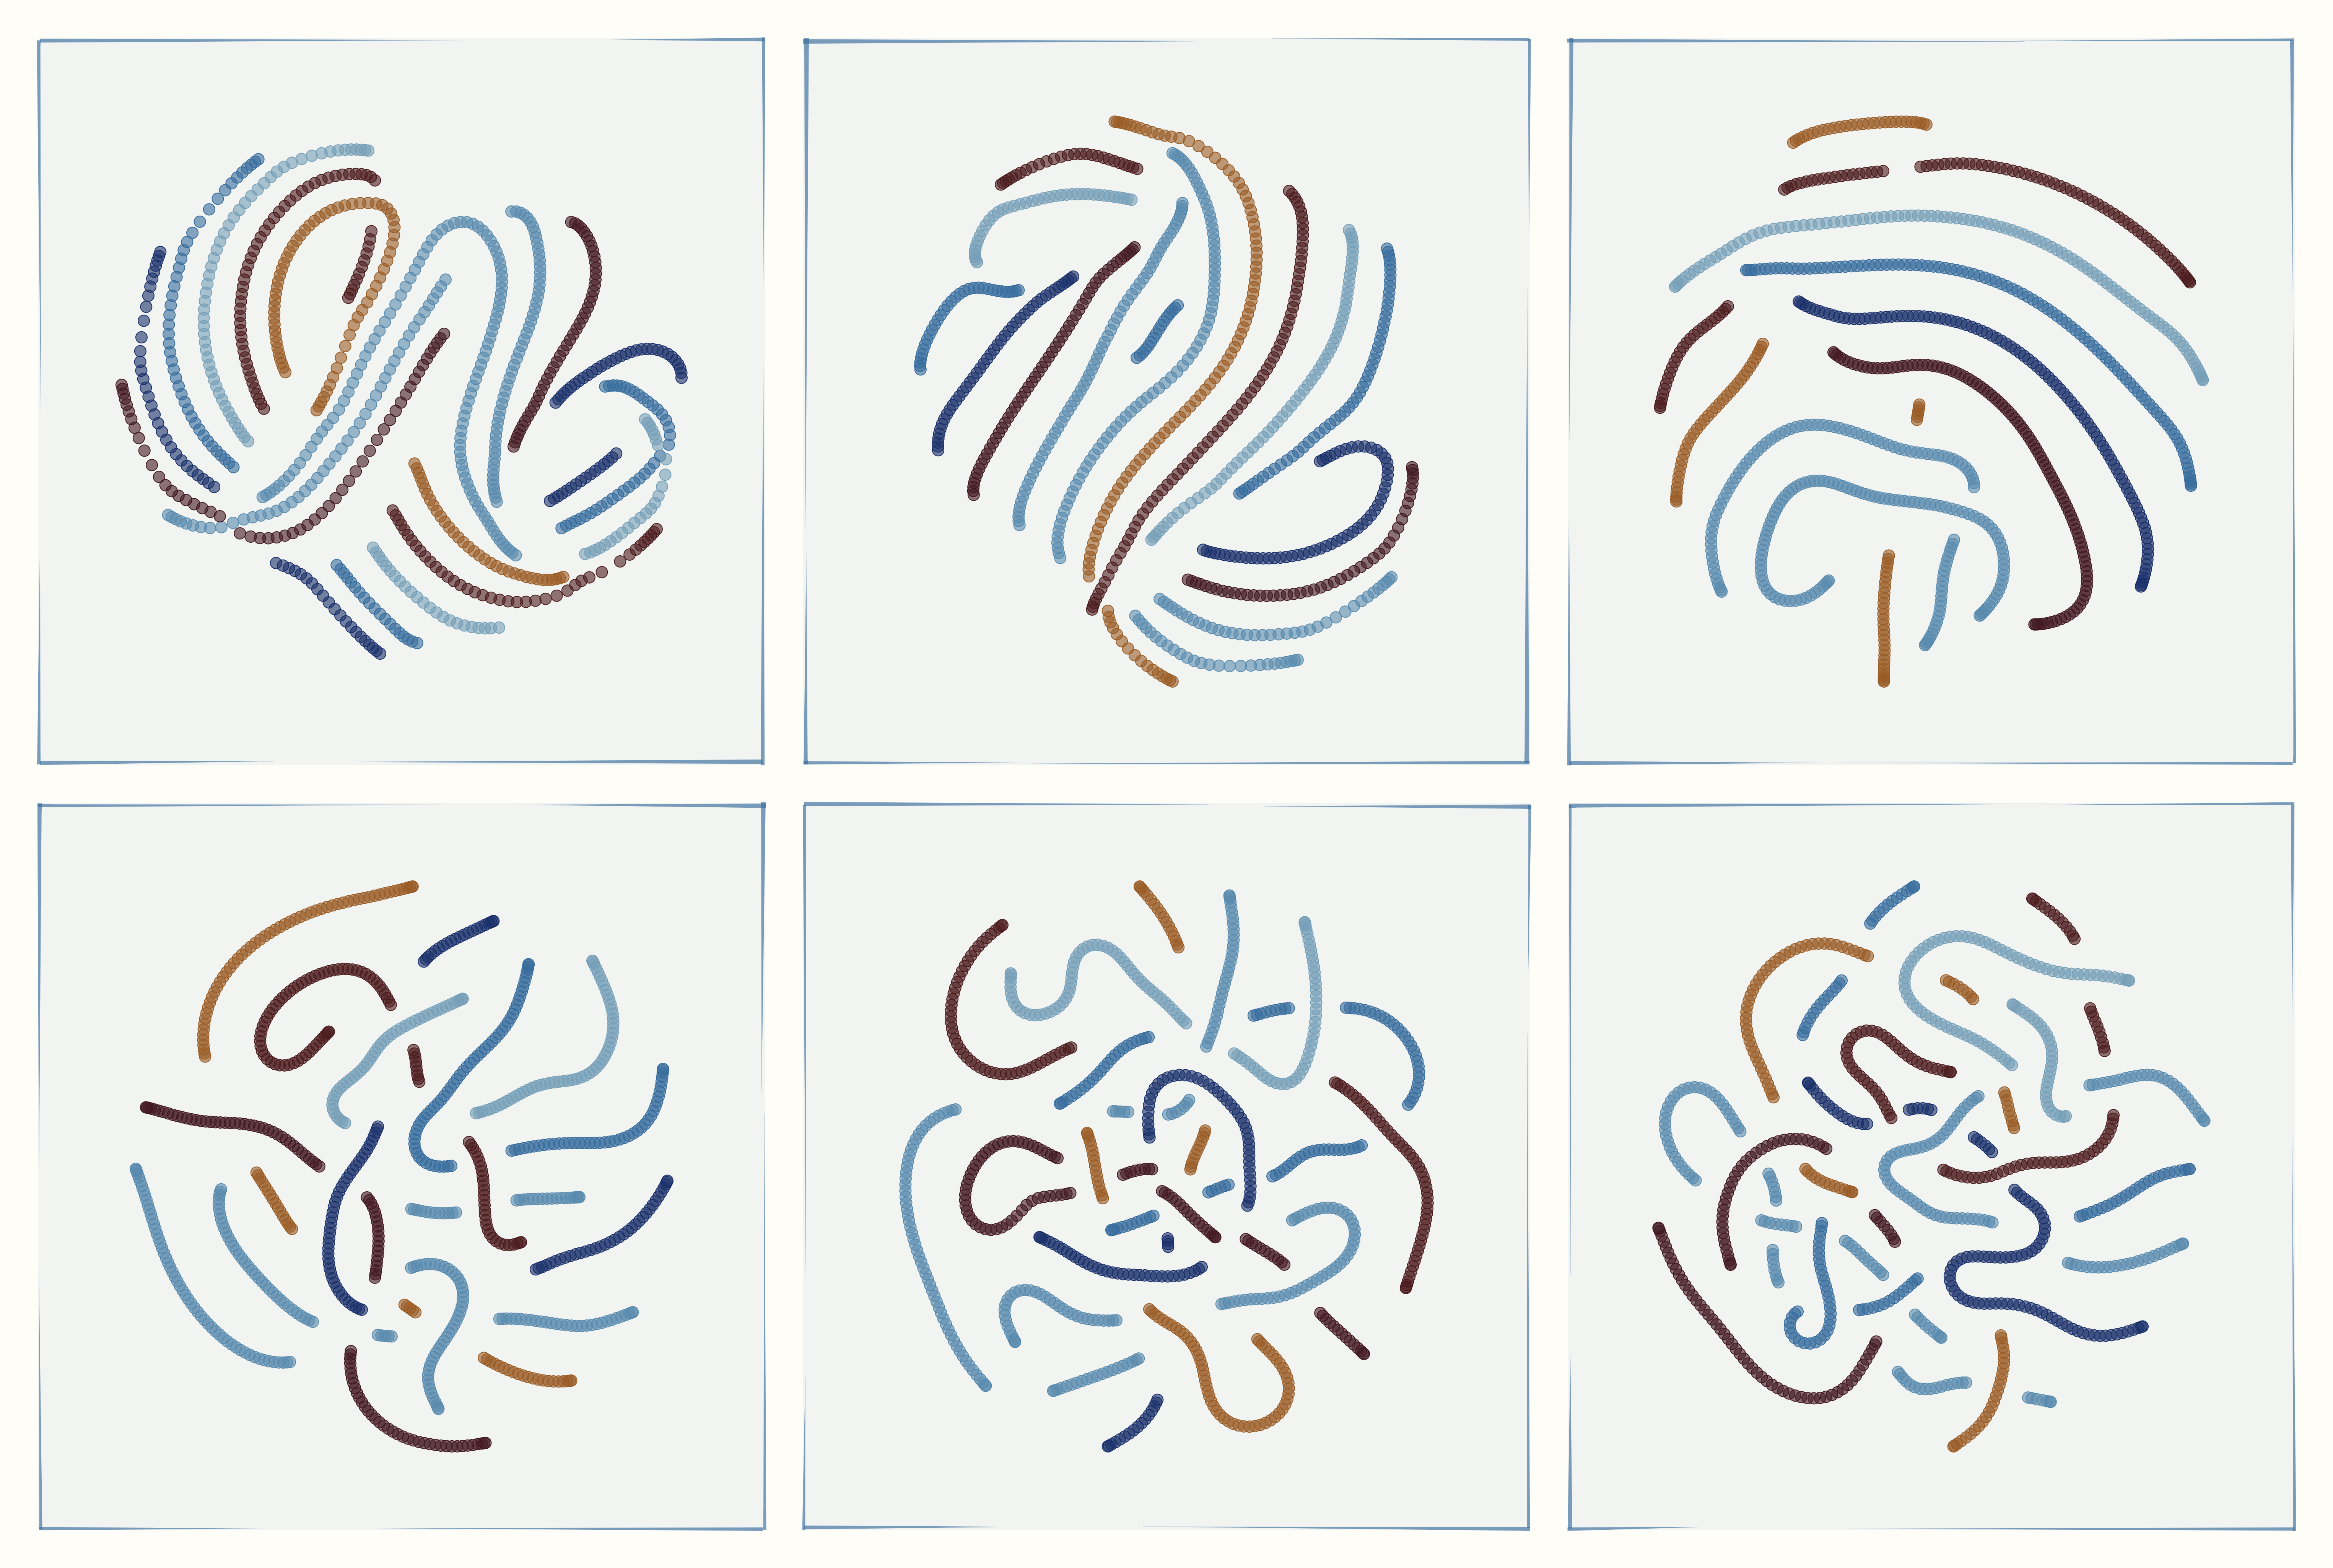
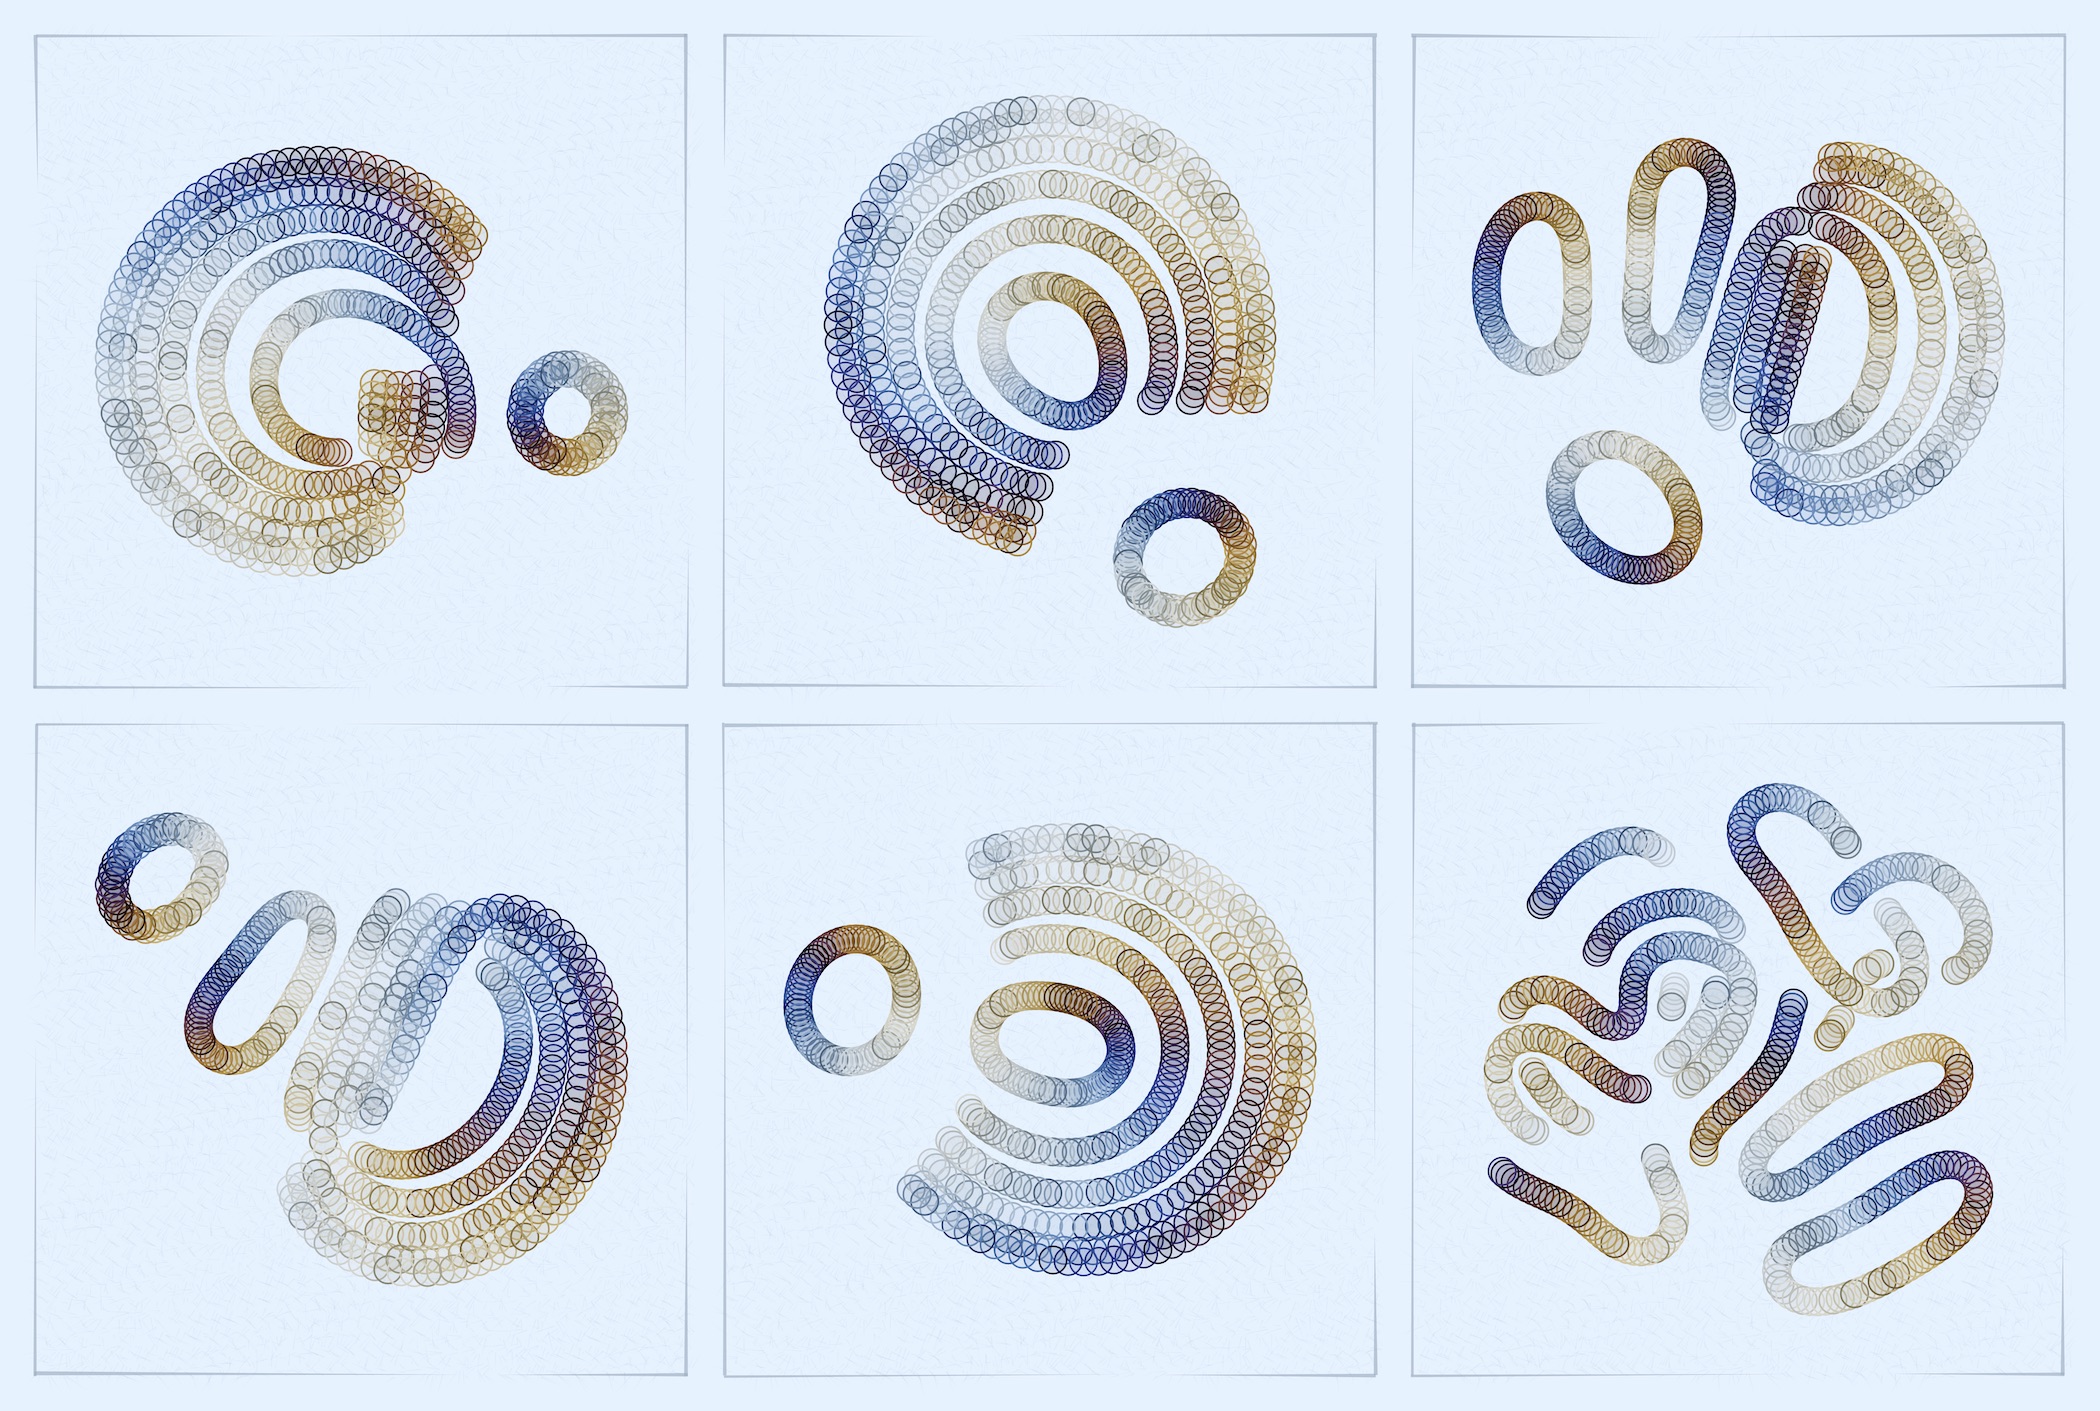
In the perplexity progression style, the t-SNE perplexity parameter is systematically varied among the panels. The perplexity parameter has a strong effect on the final geometric arrangement of each panel, see below for more detail. Varying the perplexity tends to result in outputs in which structures seem to form or dissolve as we move from one end of the artwork to the other.
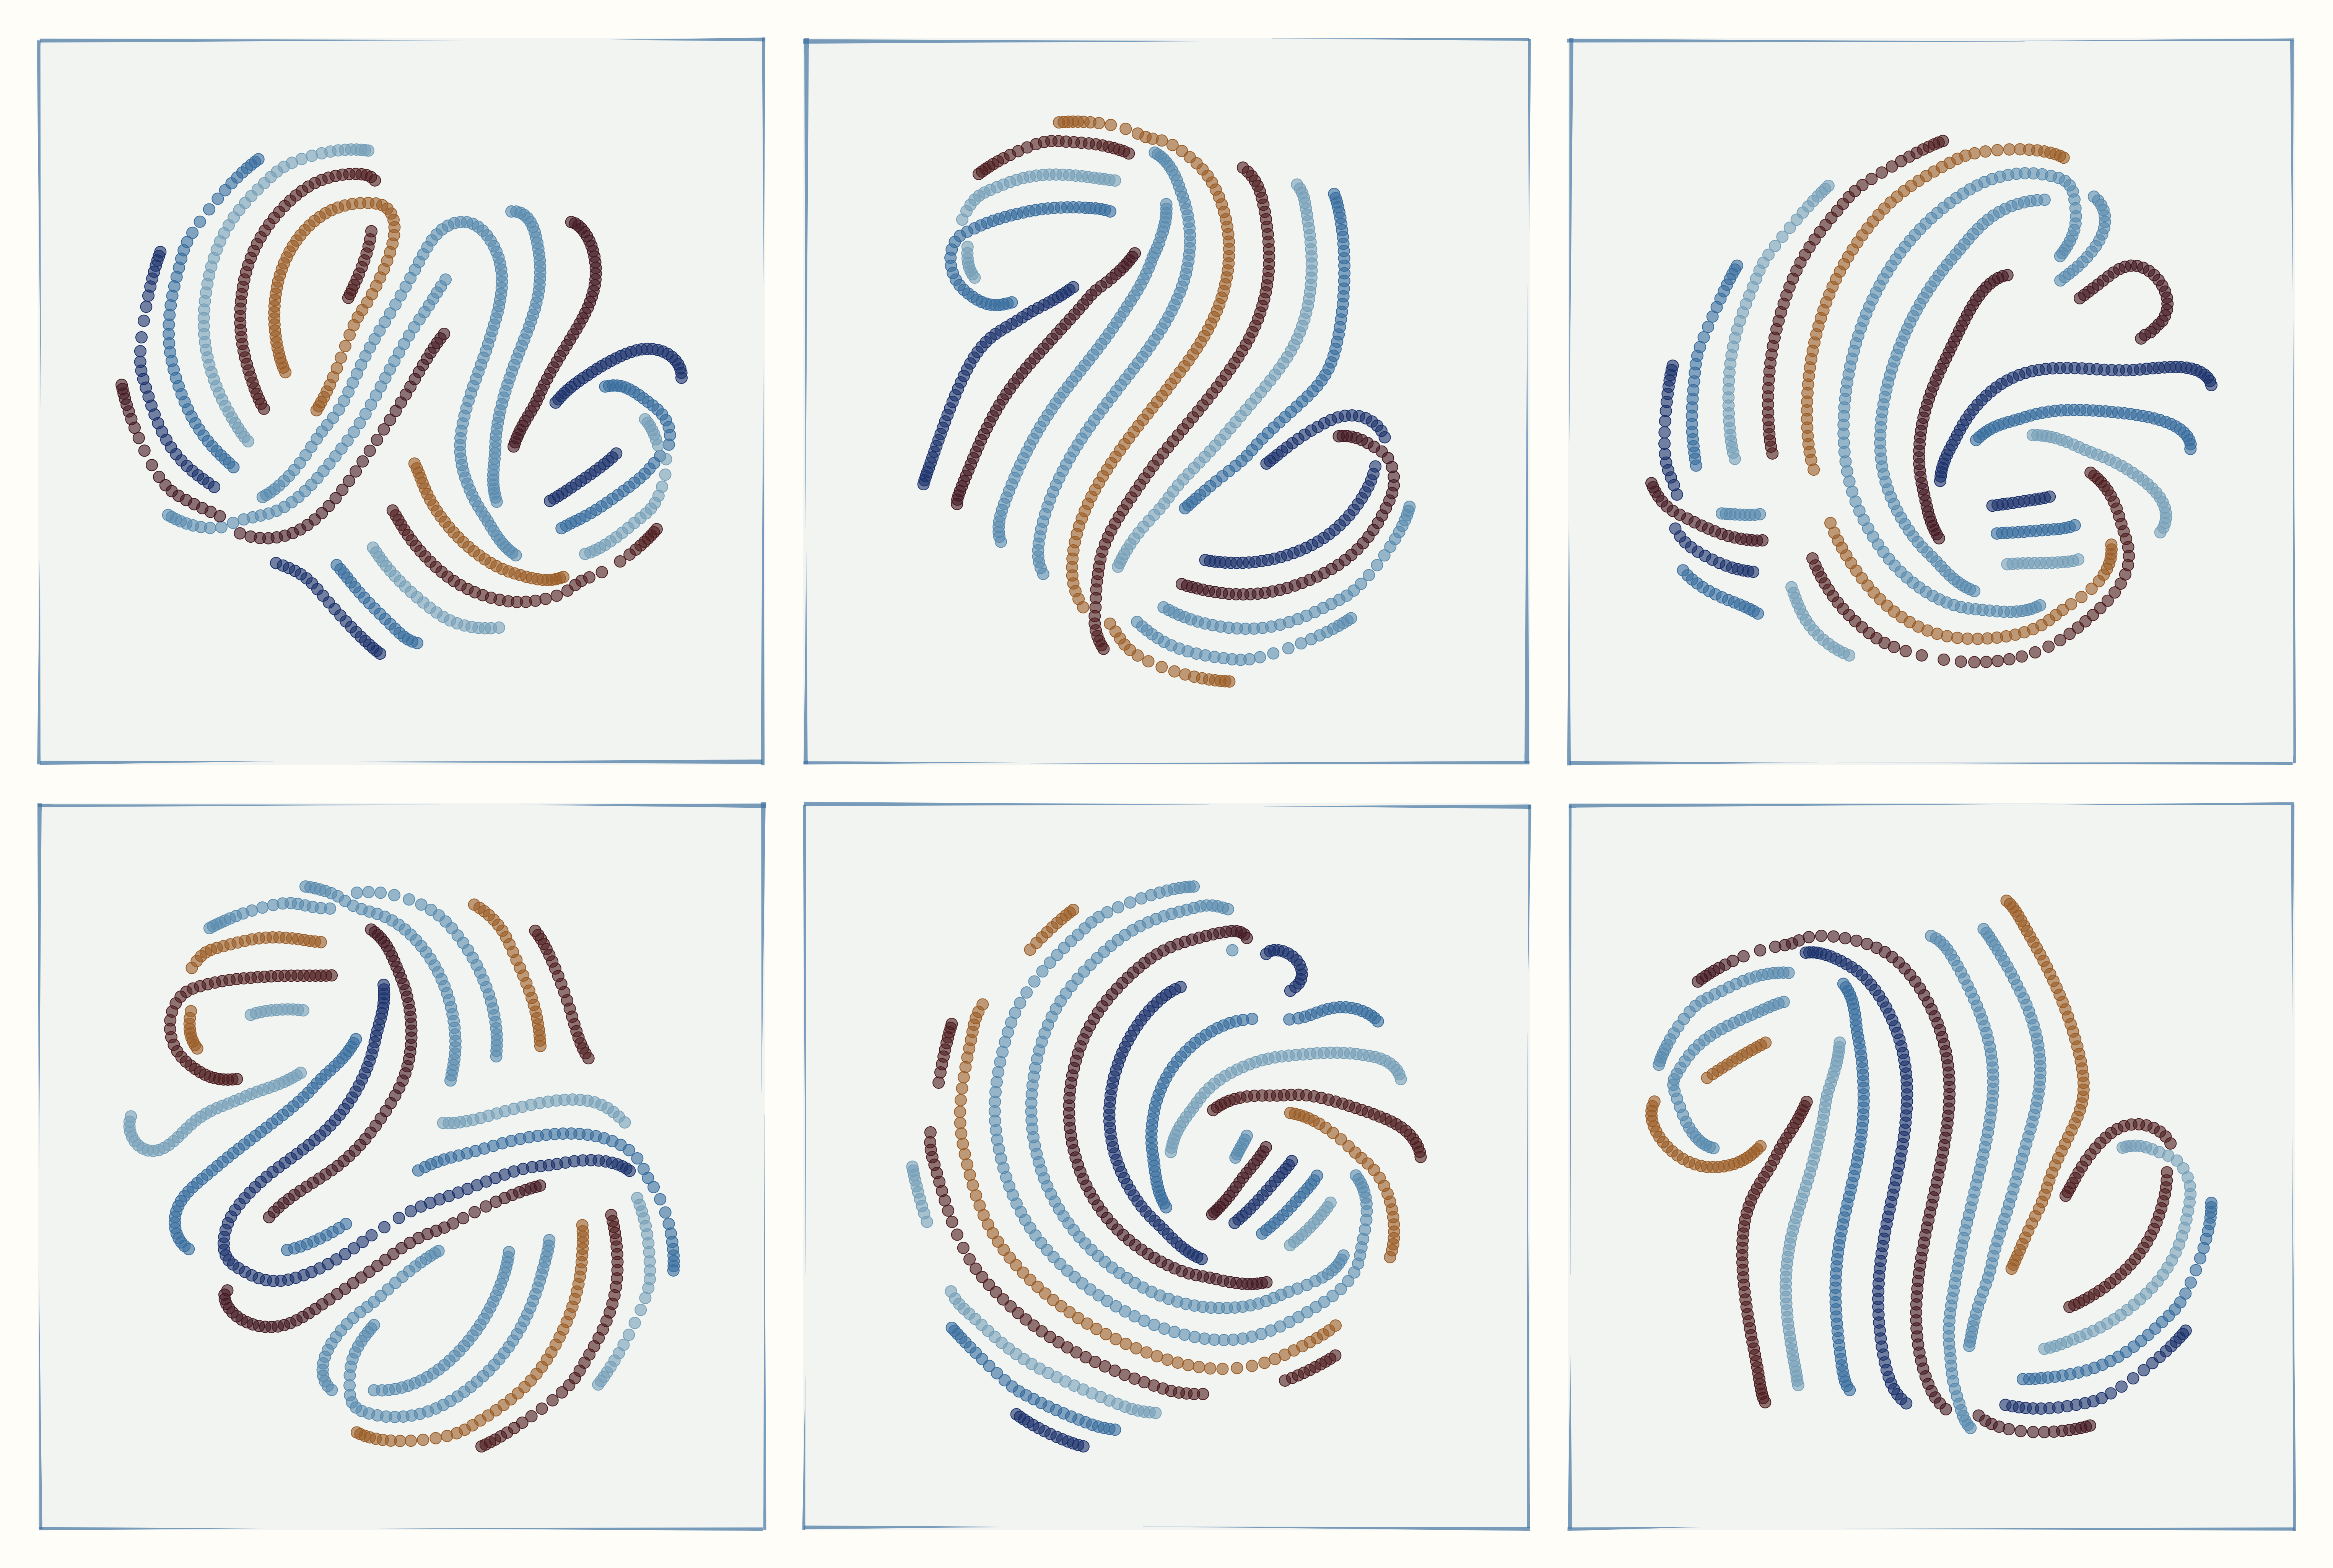
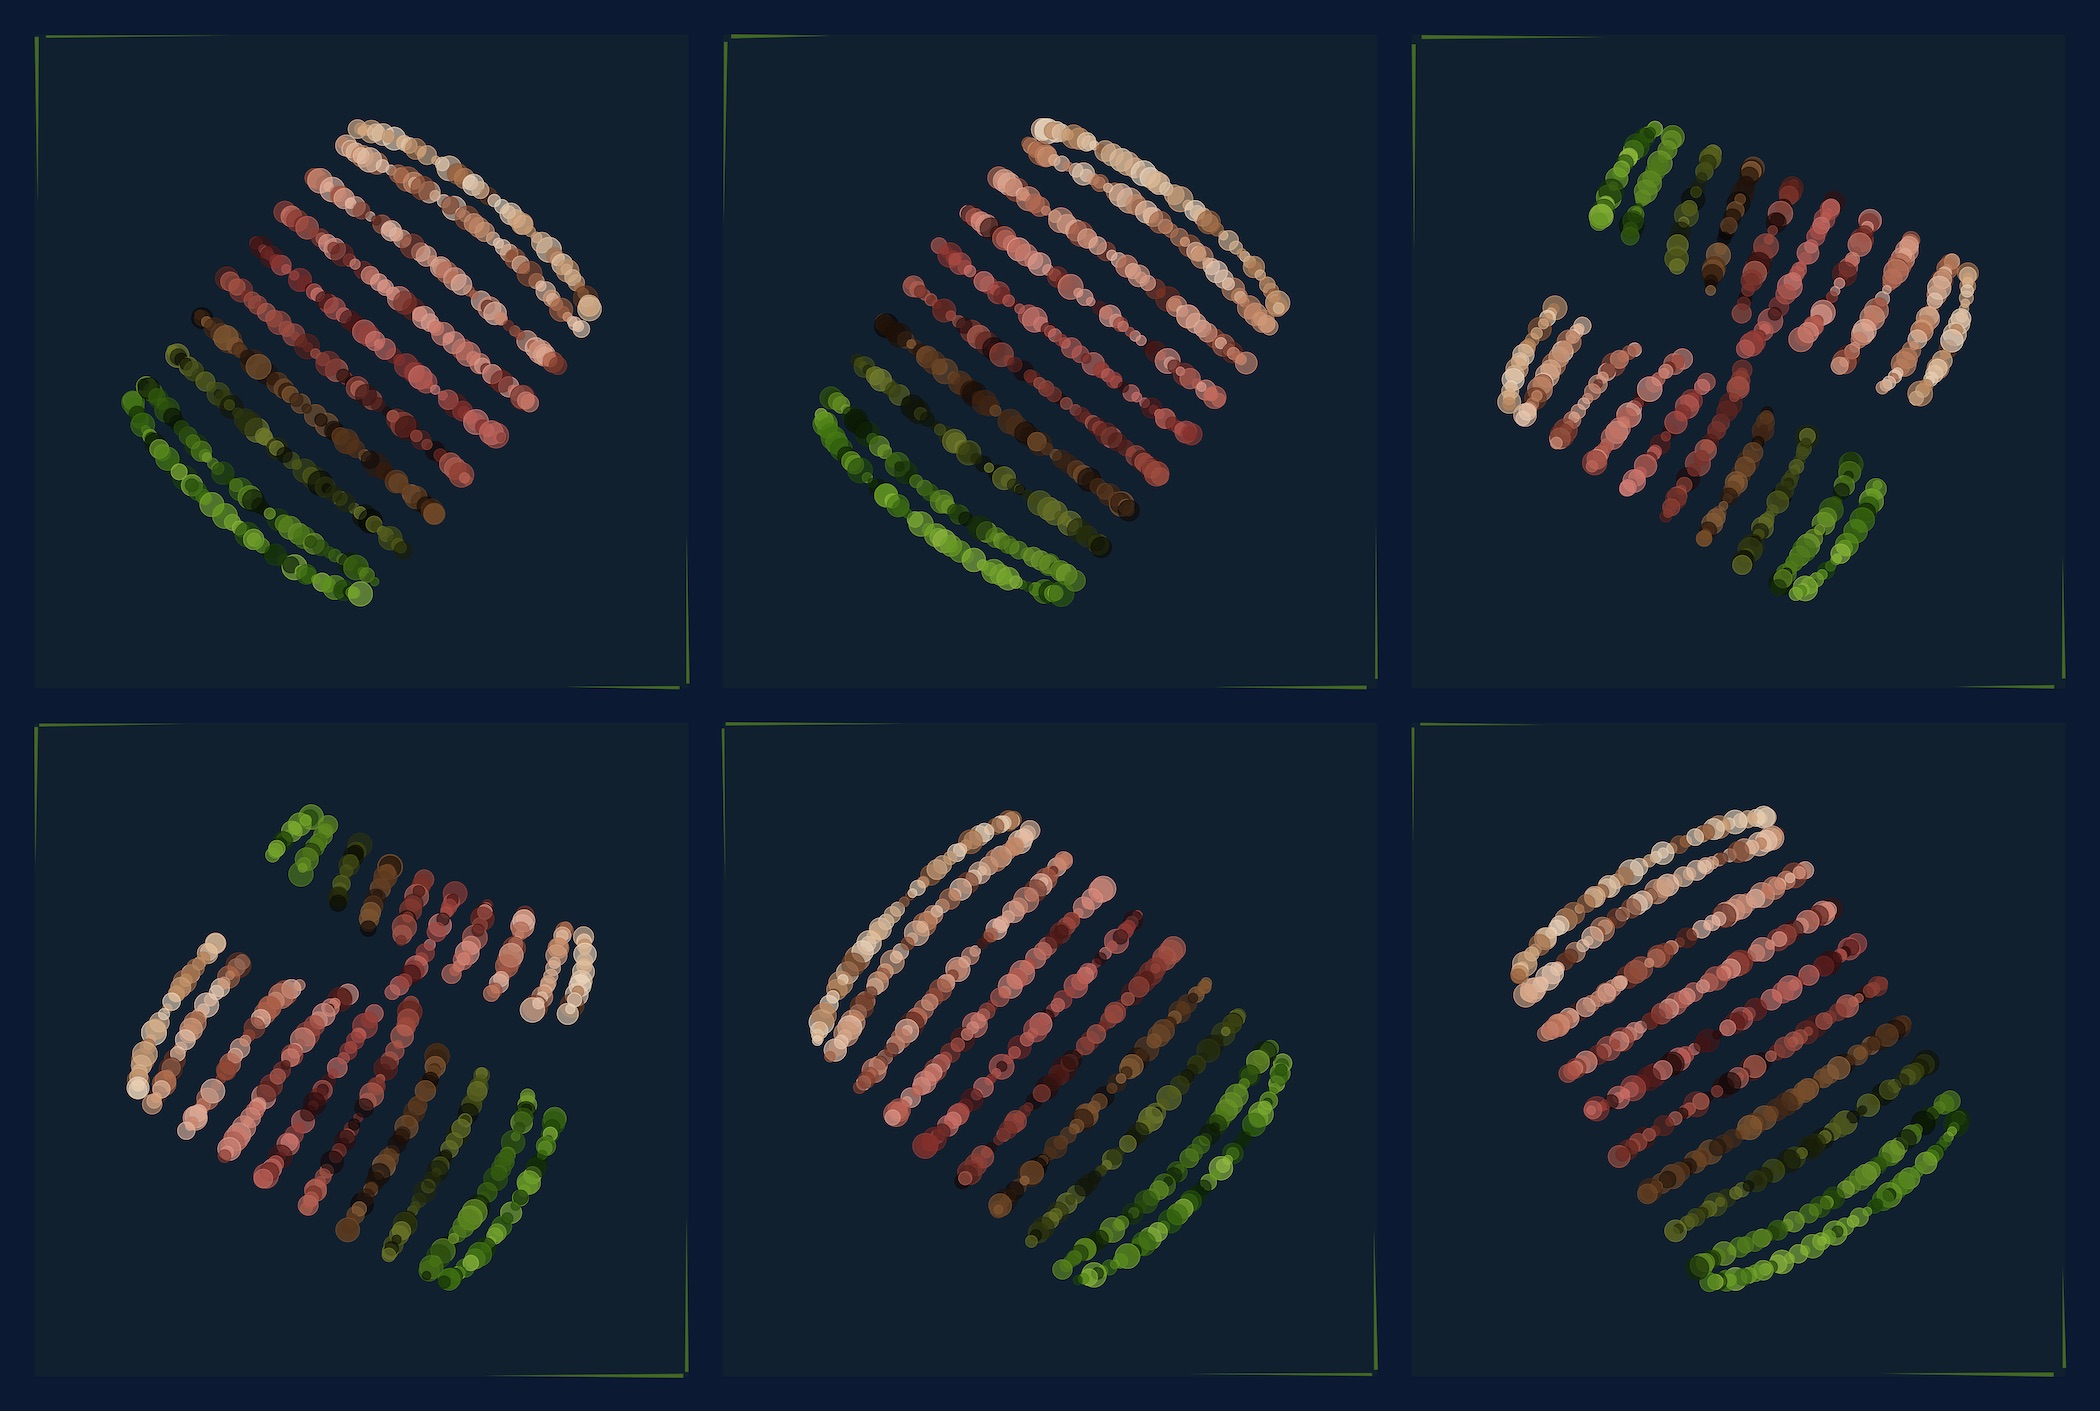
In the random seed progression style, all parameter values are held constant across panels but the random seed used by the t-SNE algorithm is different for each panel. This tends to result in multiple outputs that all look similar and closely related yet also clearly distinct.
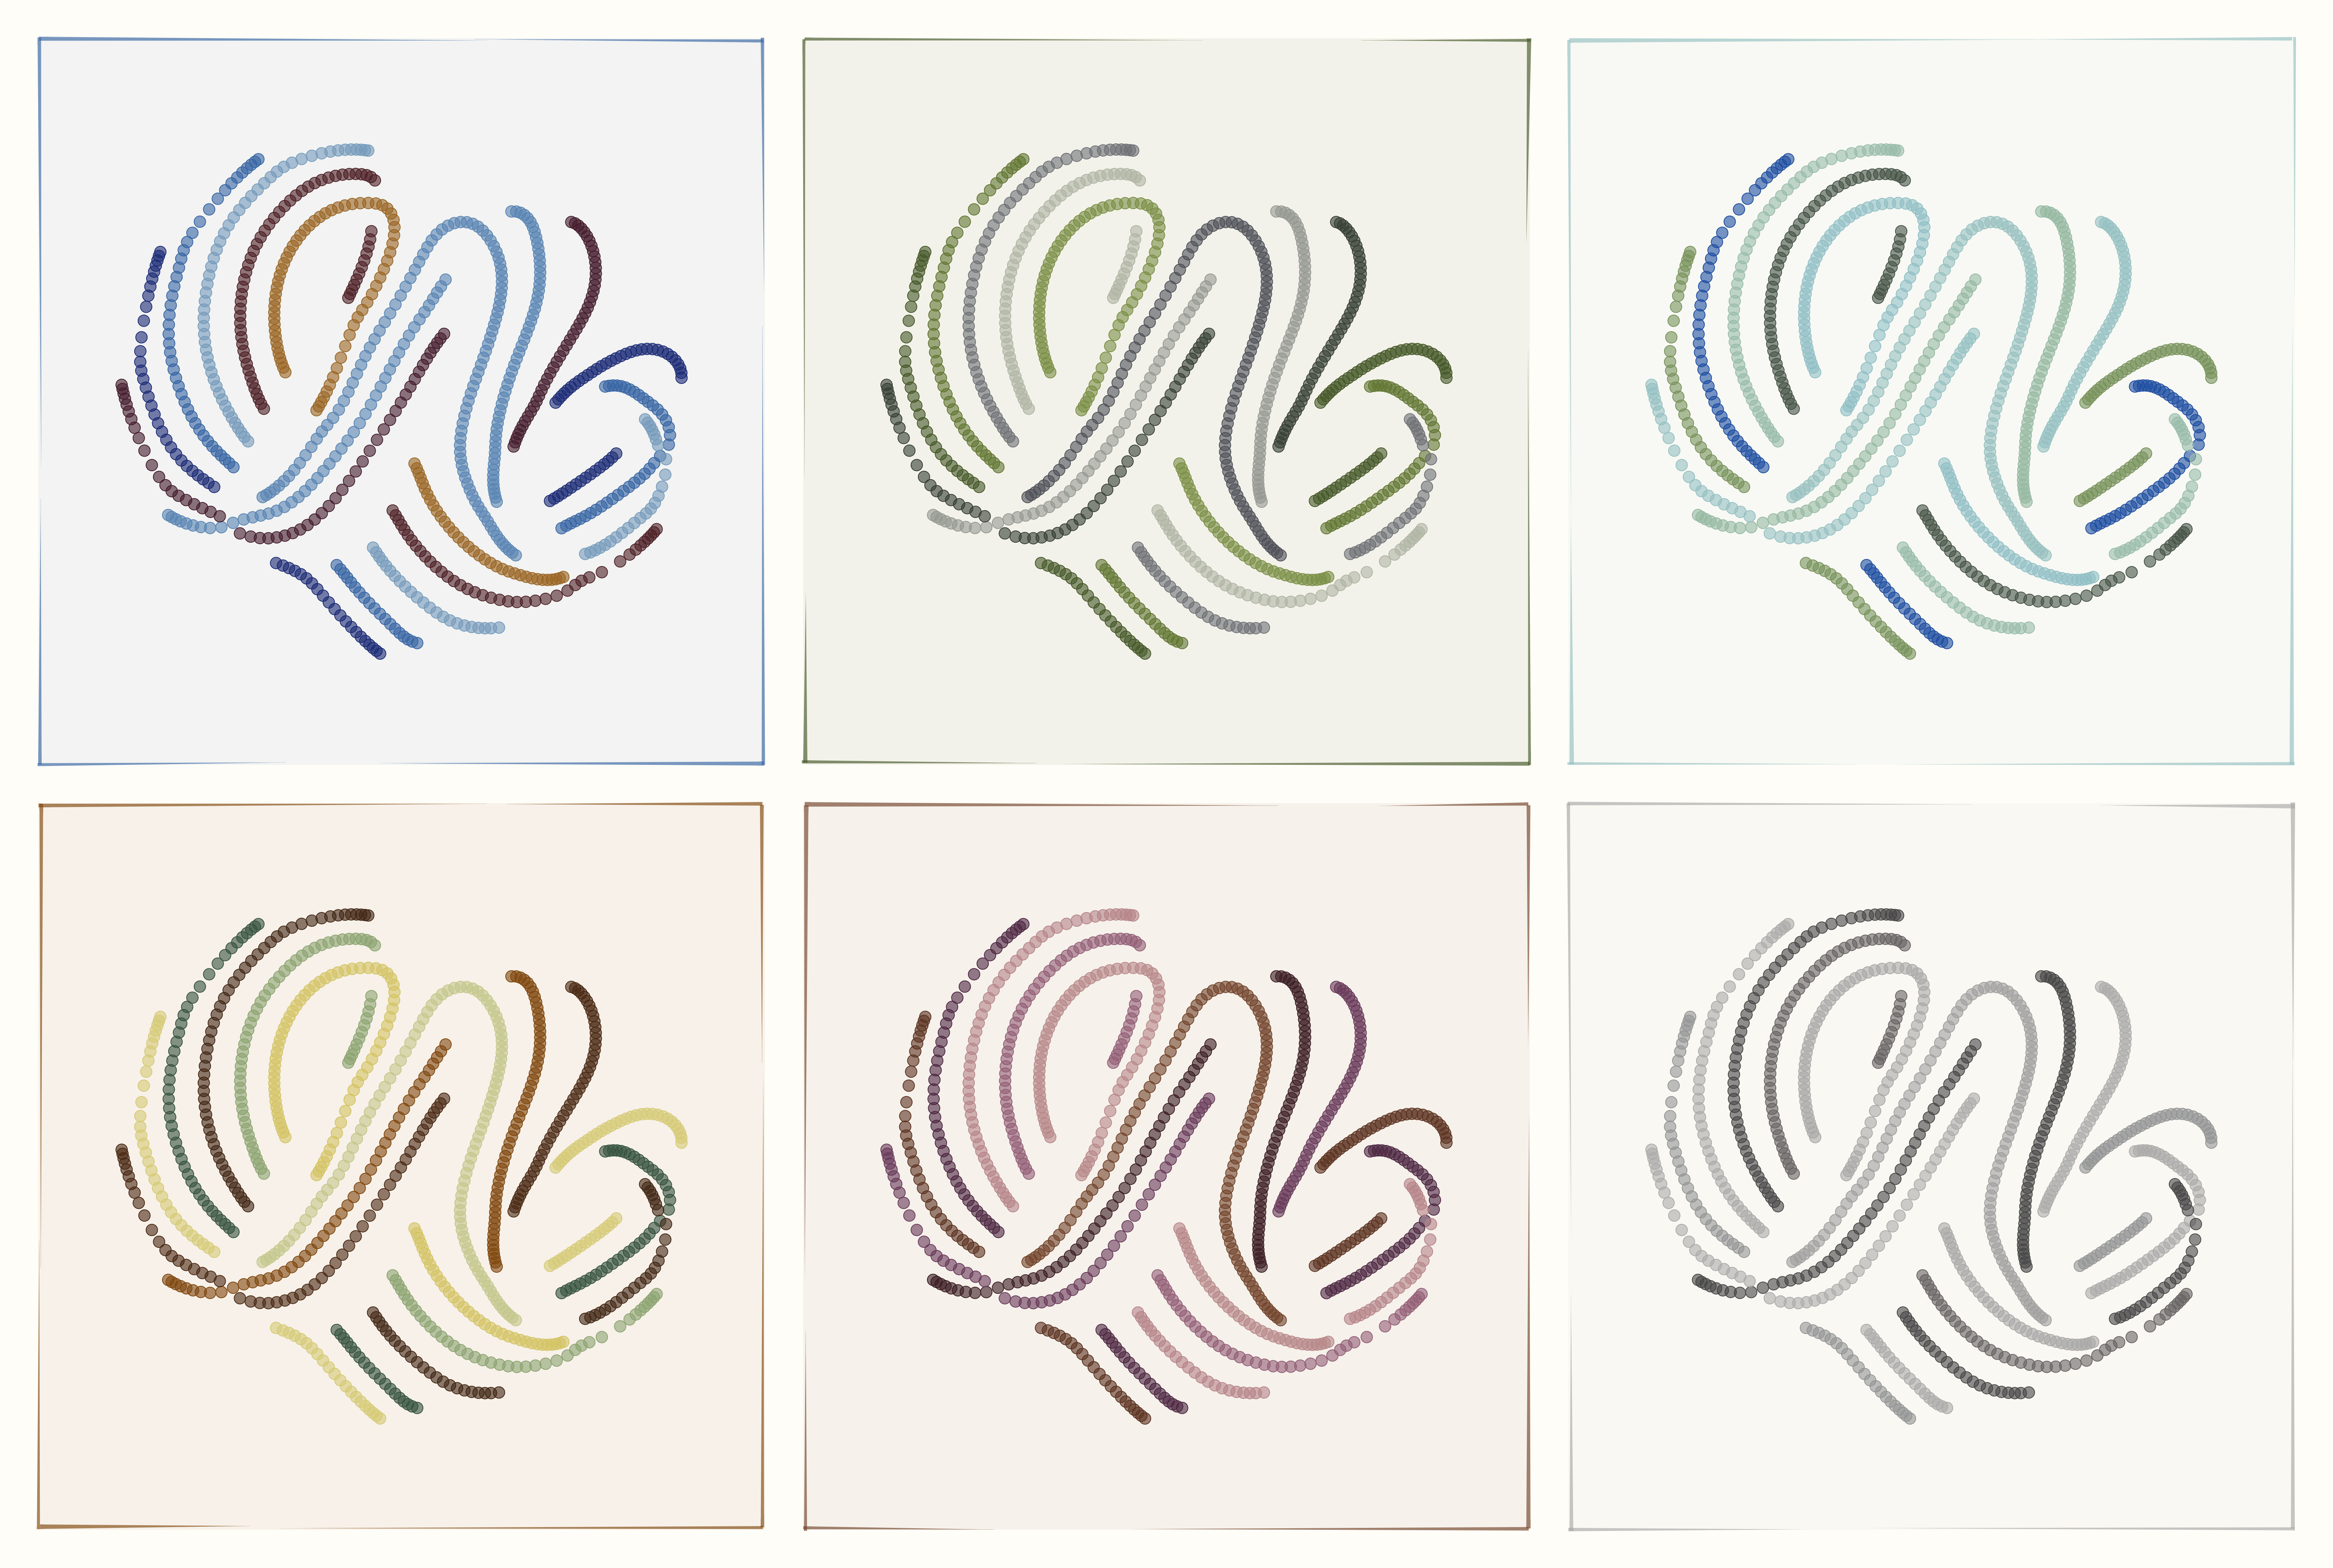
In the color palette progression, I am varying the foreground color palette between panels but keep everything else the same (including the t-SNE random seed). The result is a set of multiple geometric arrangements that only differ by color.
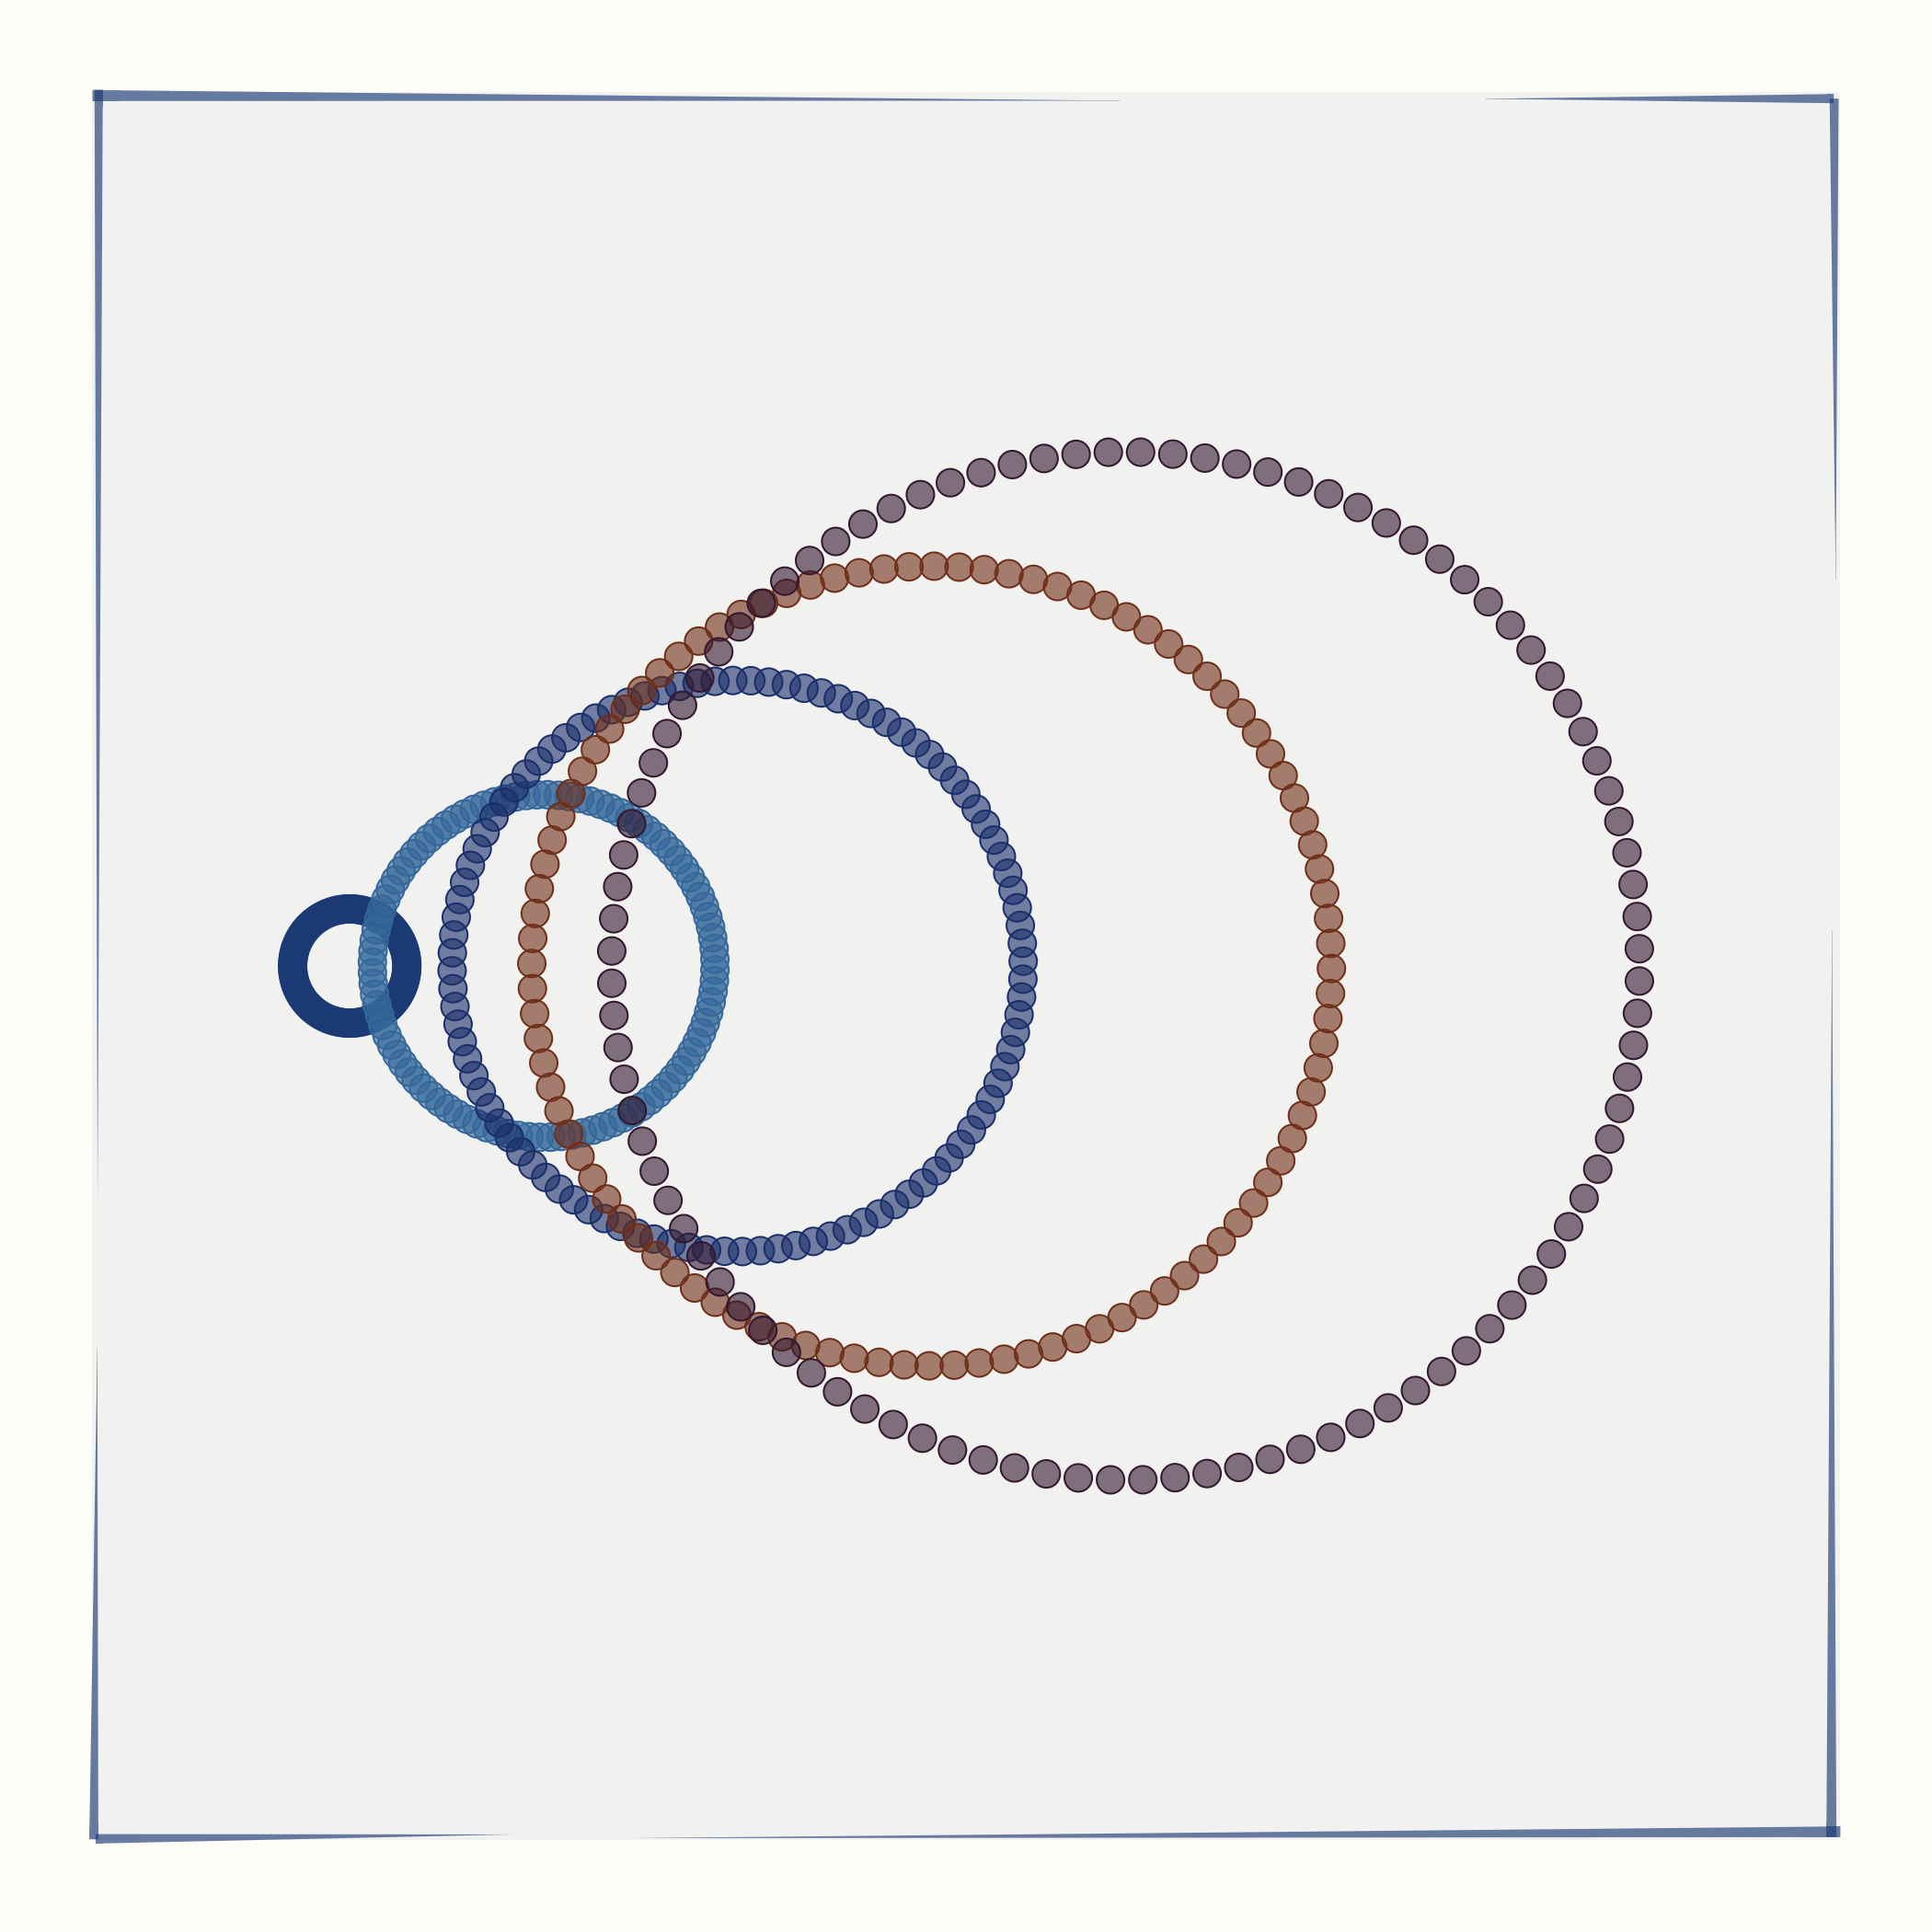
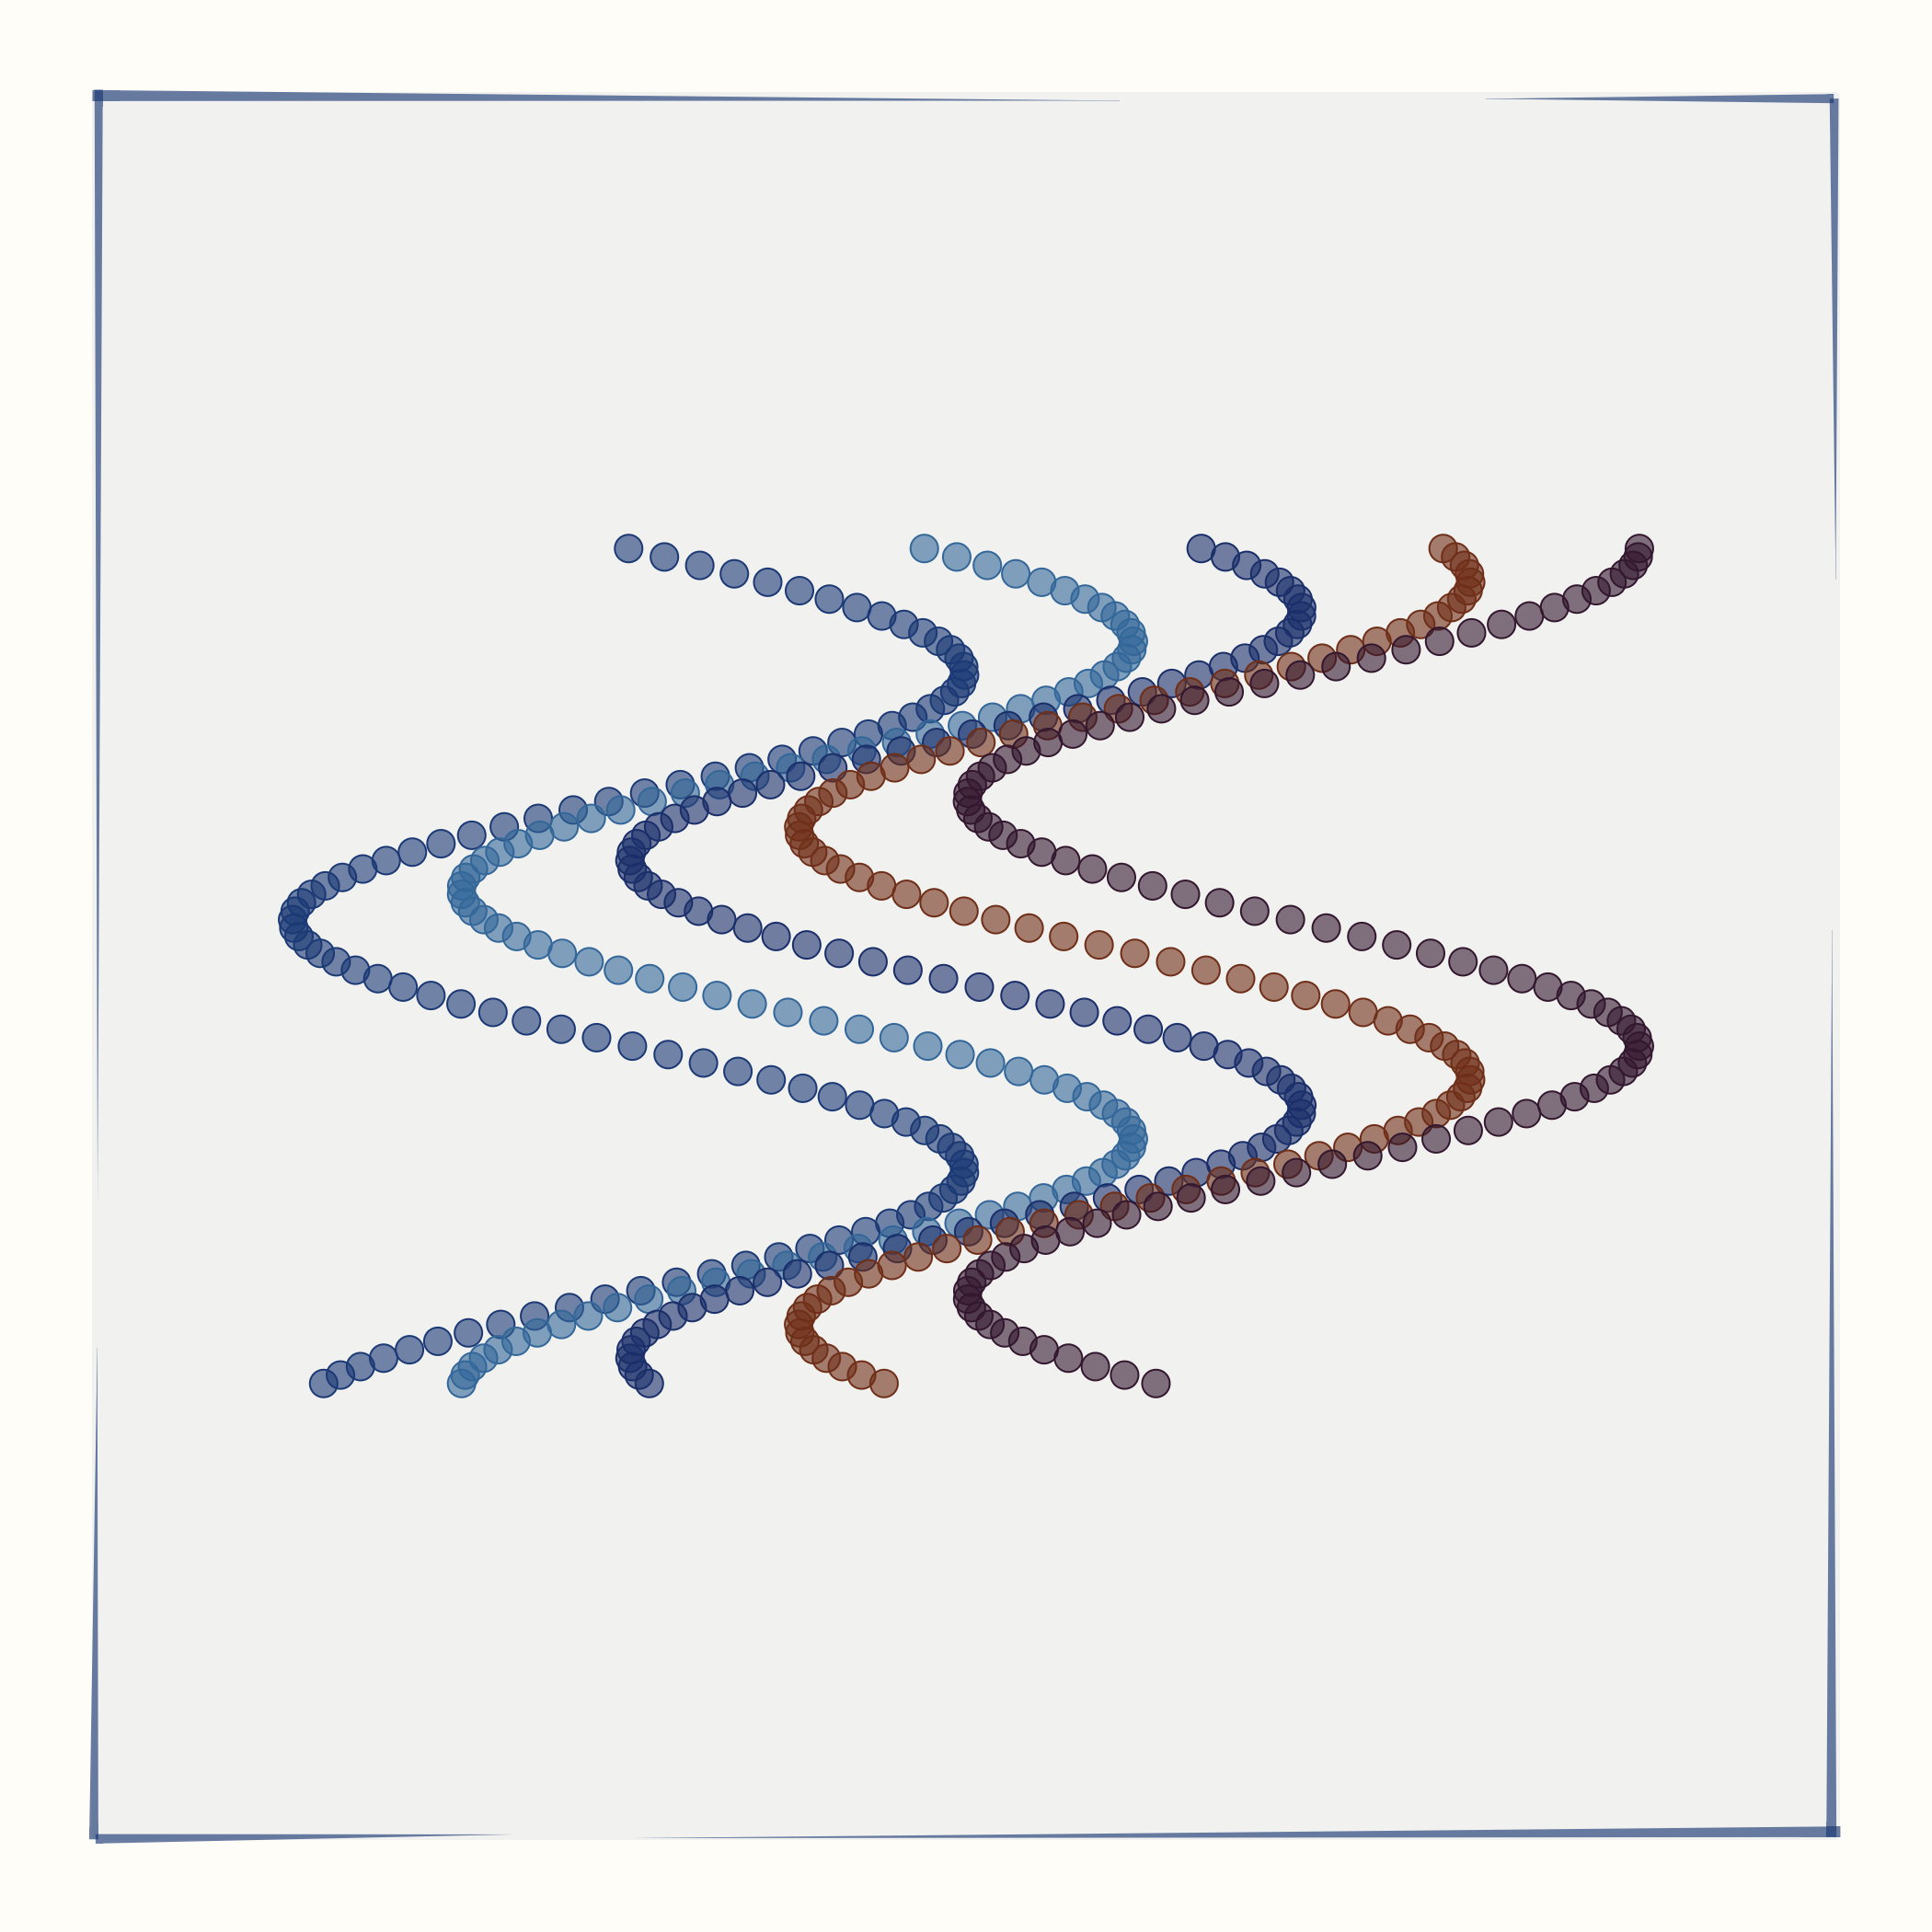
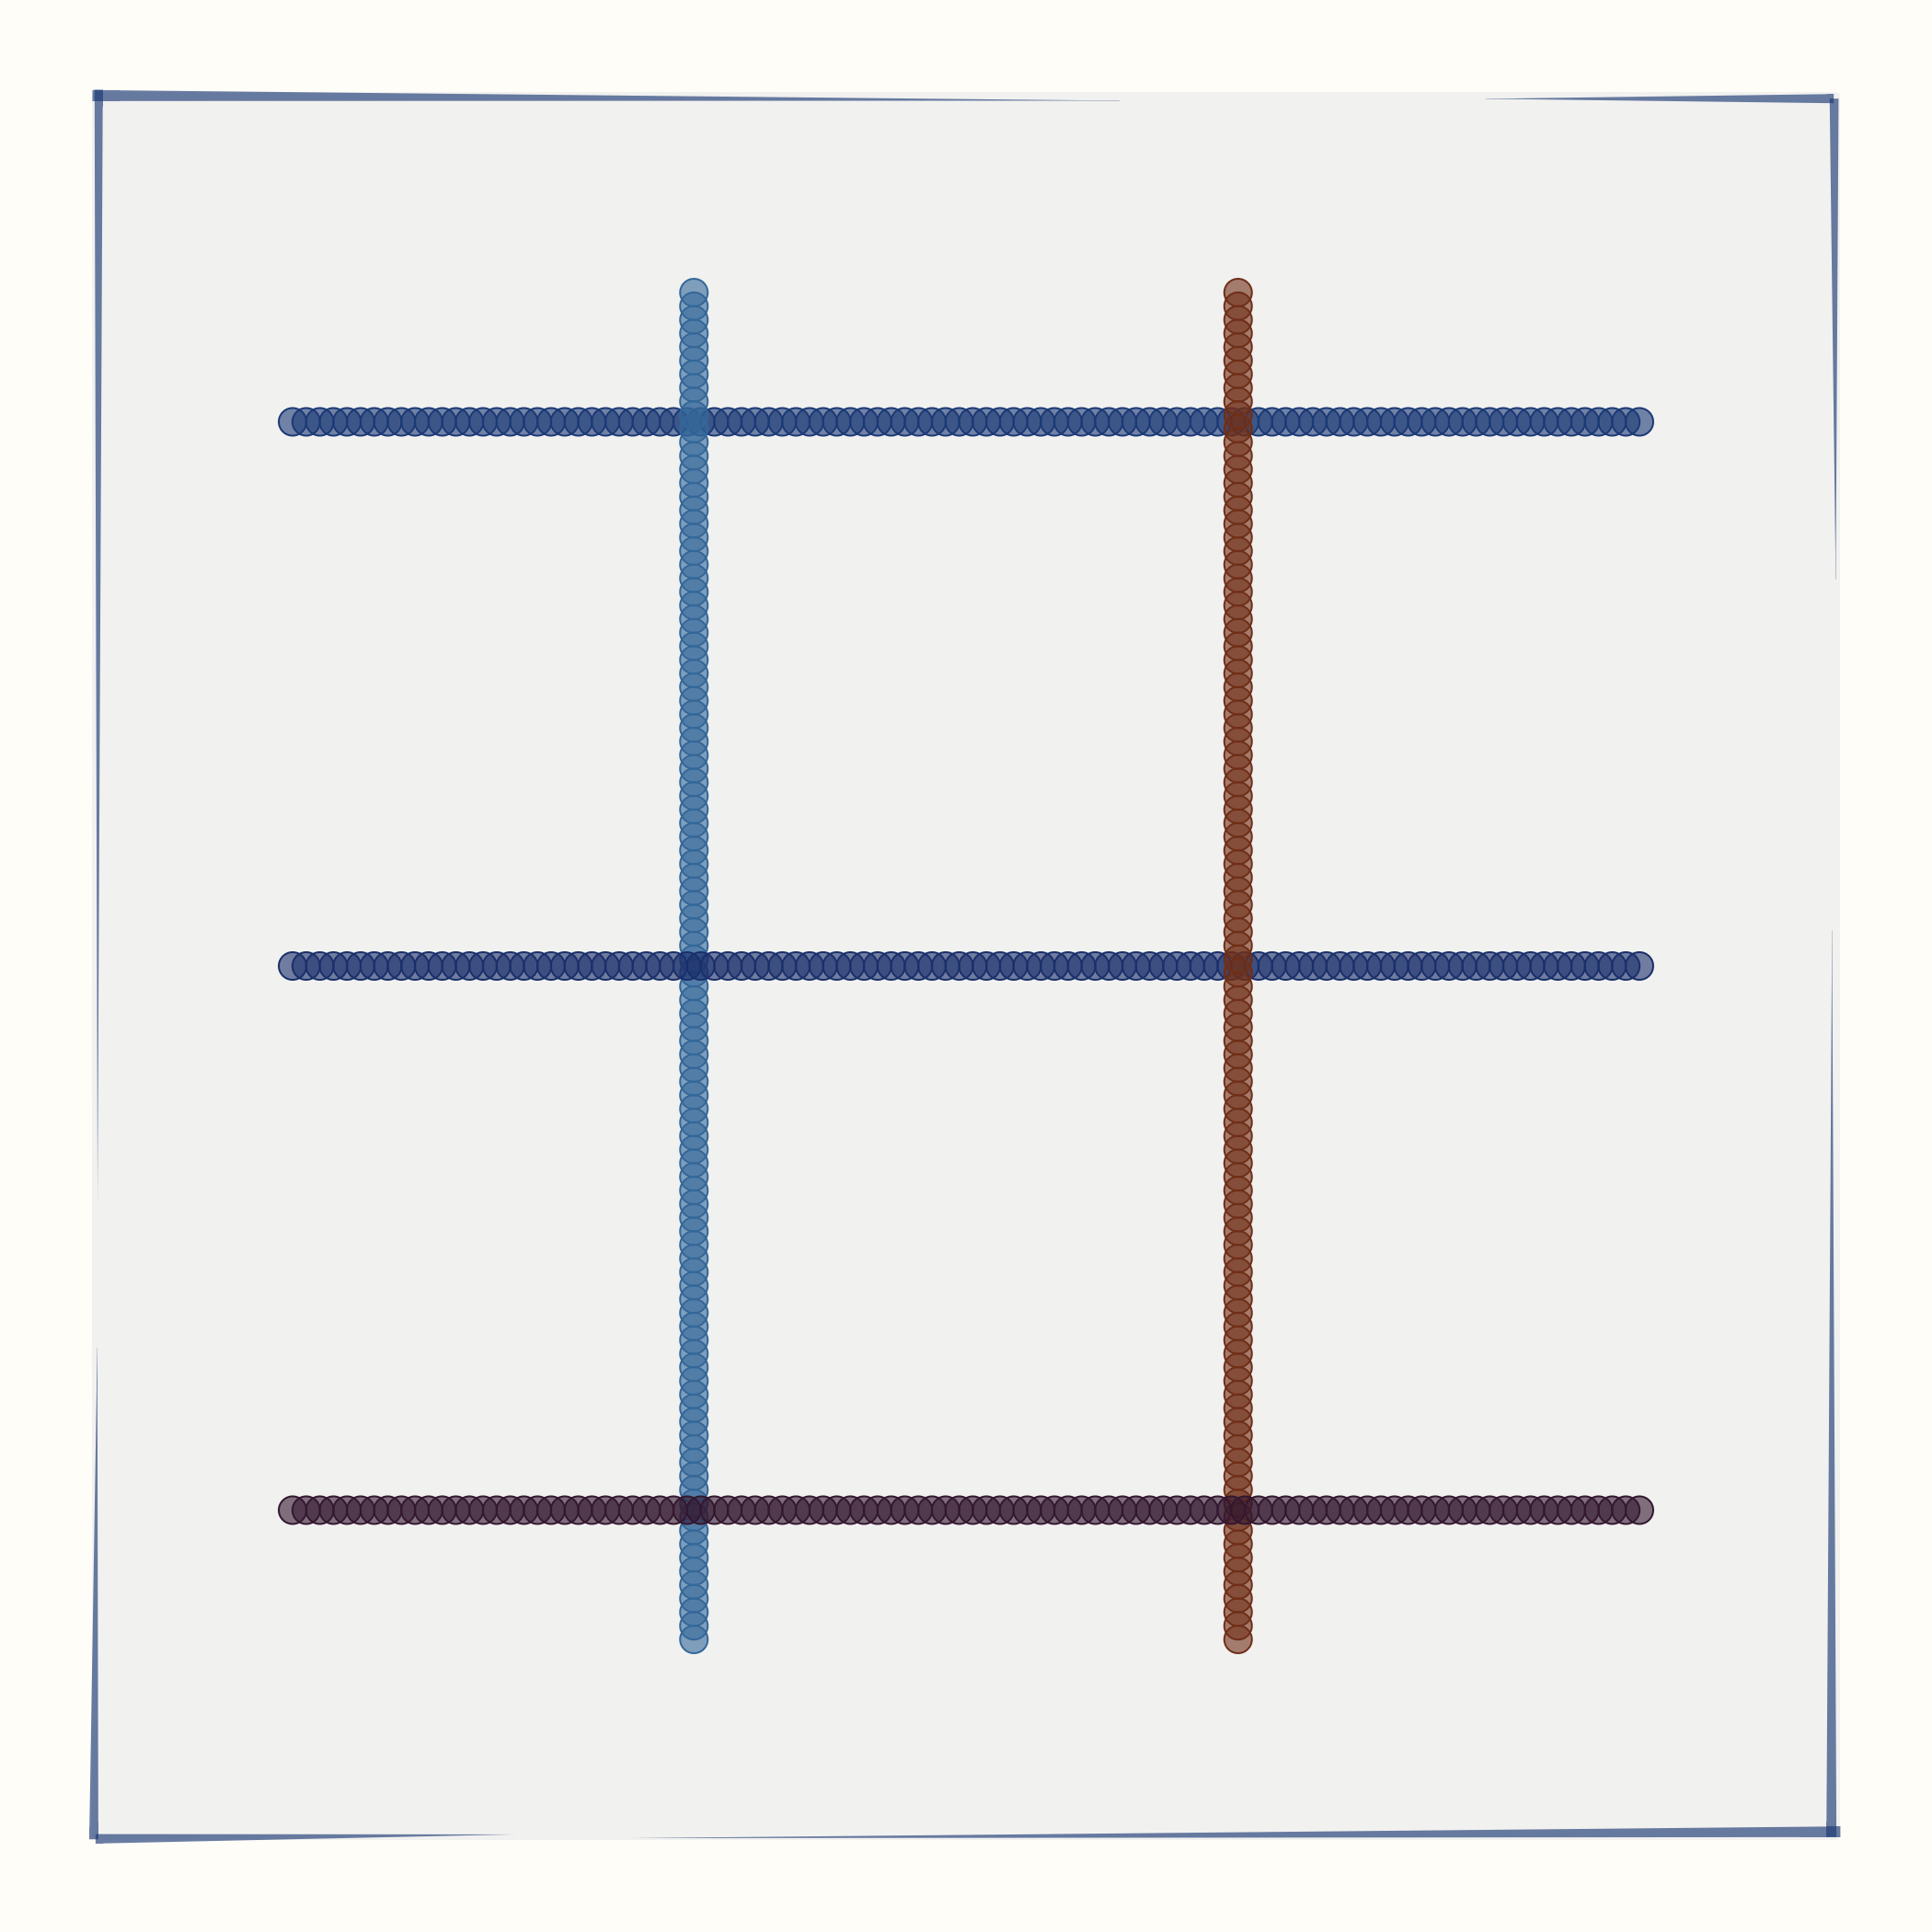
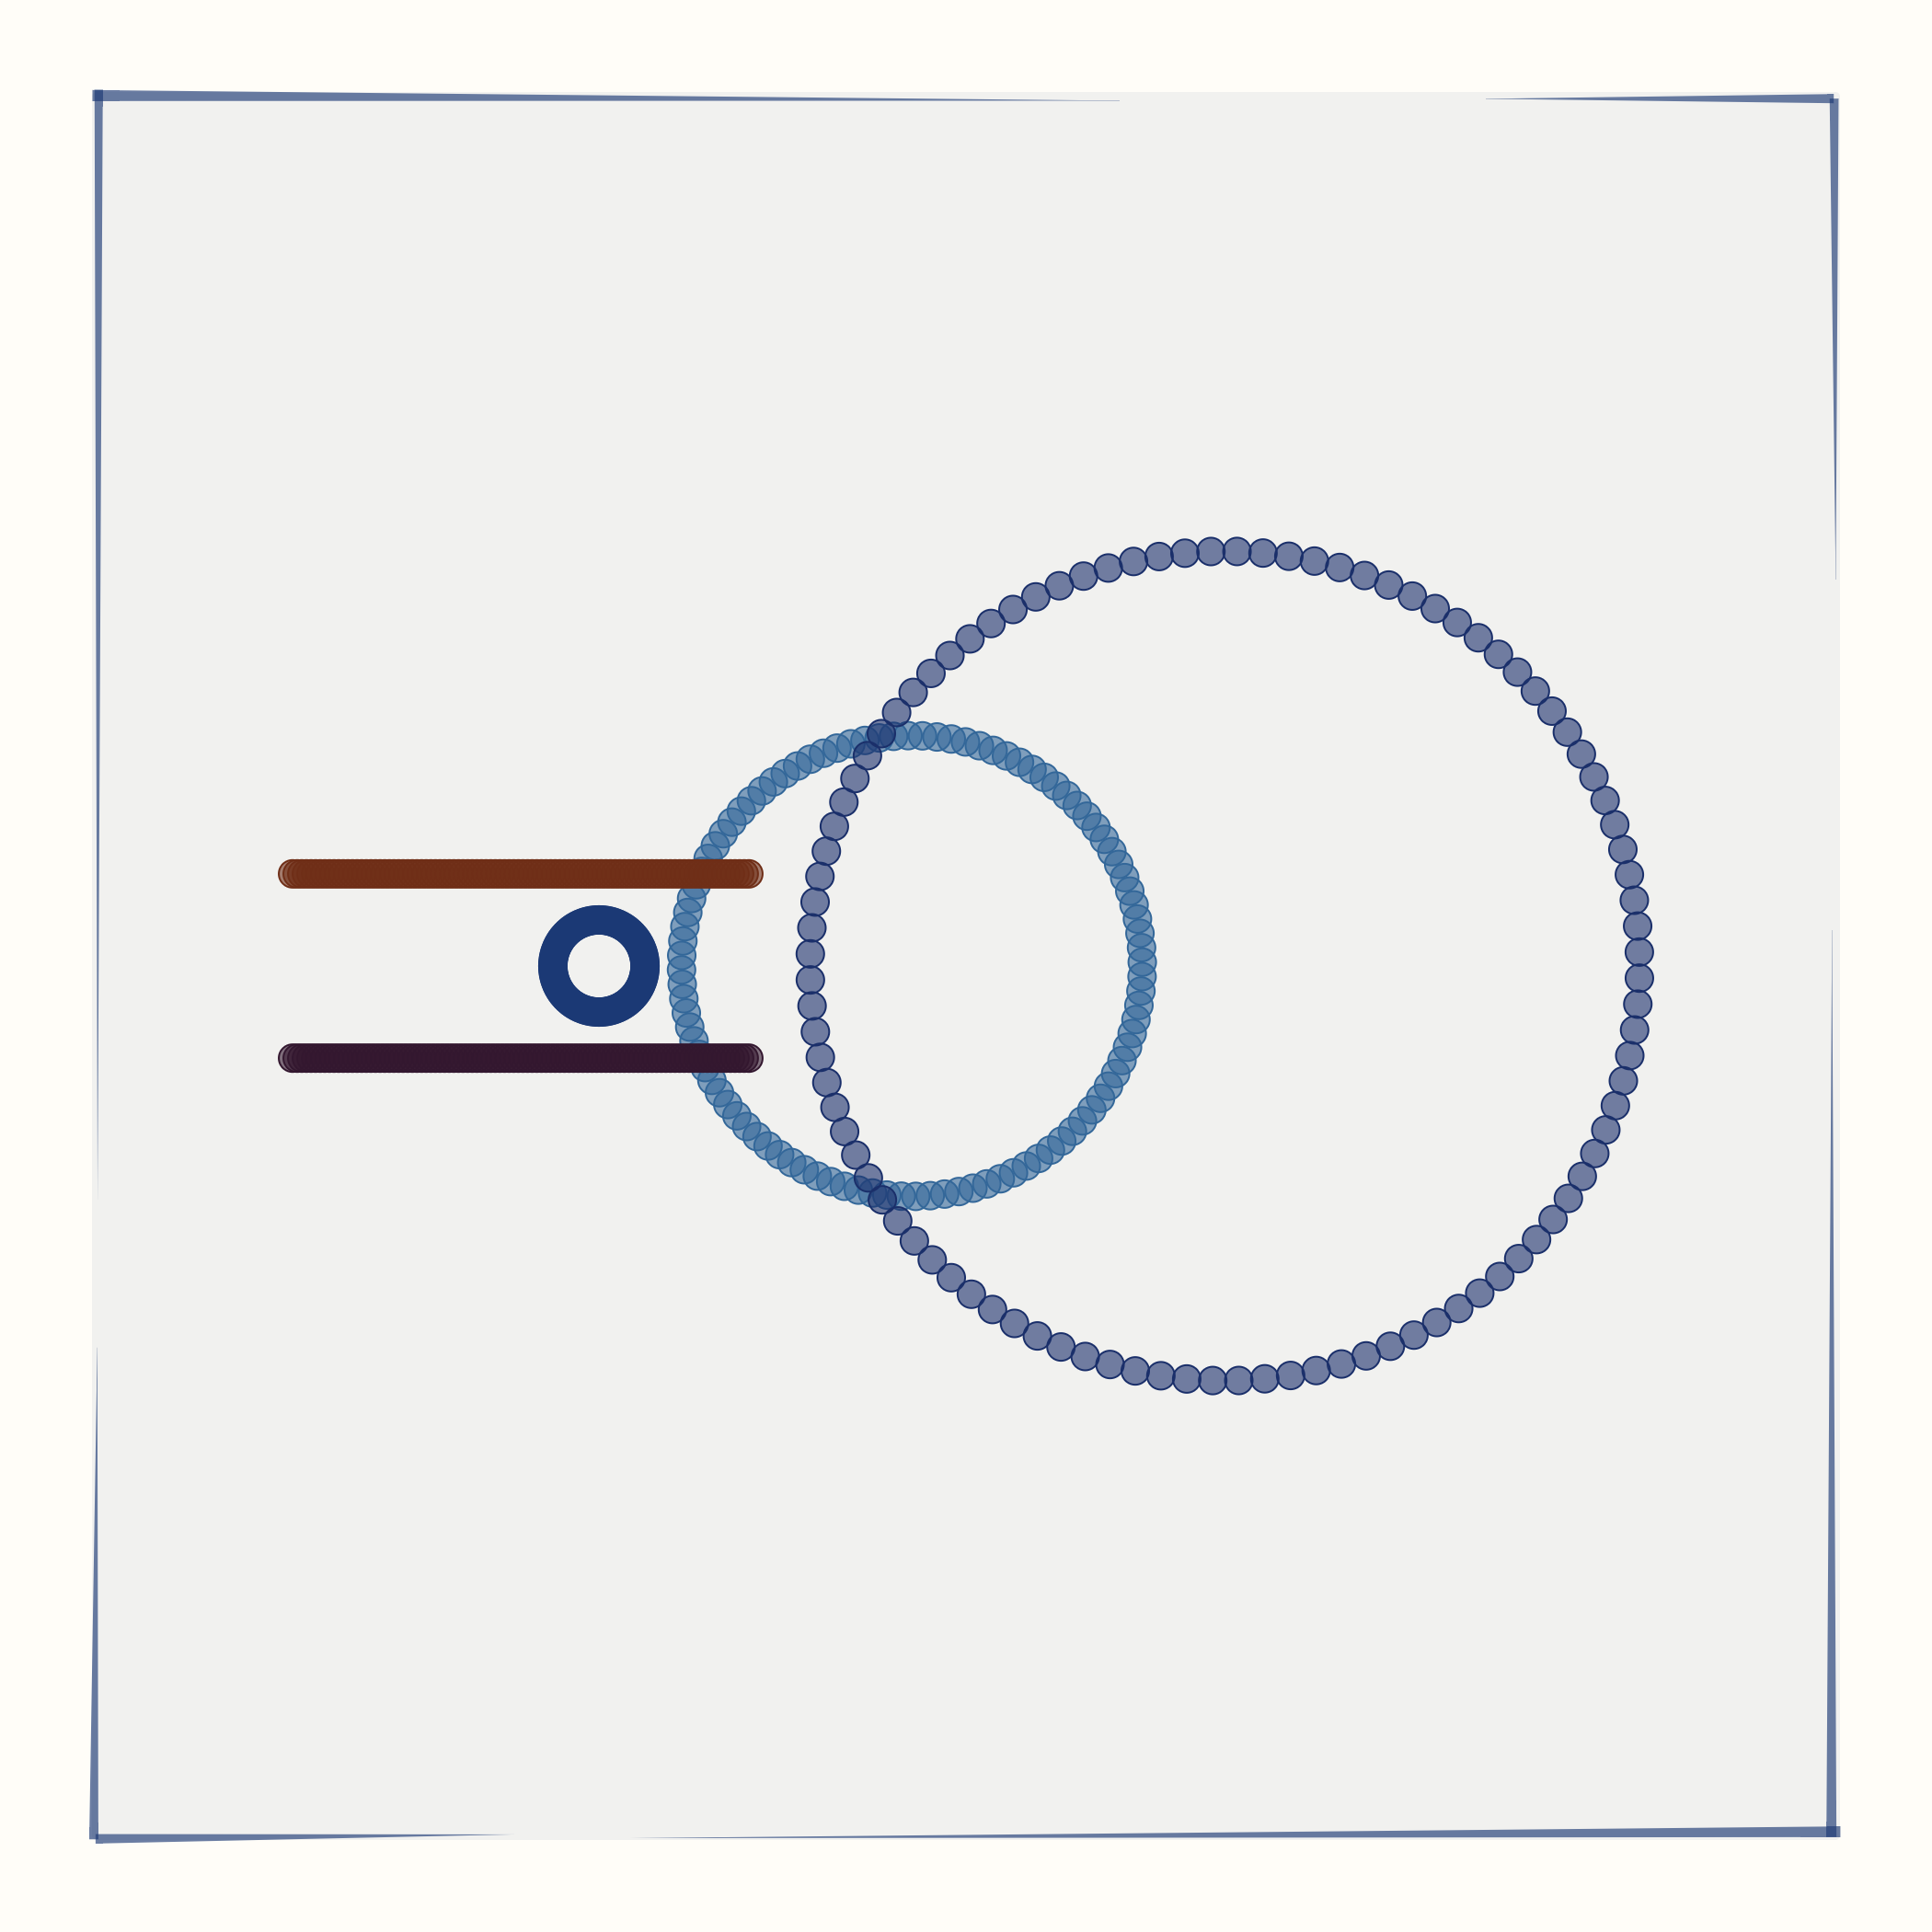
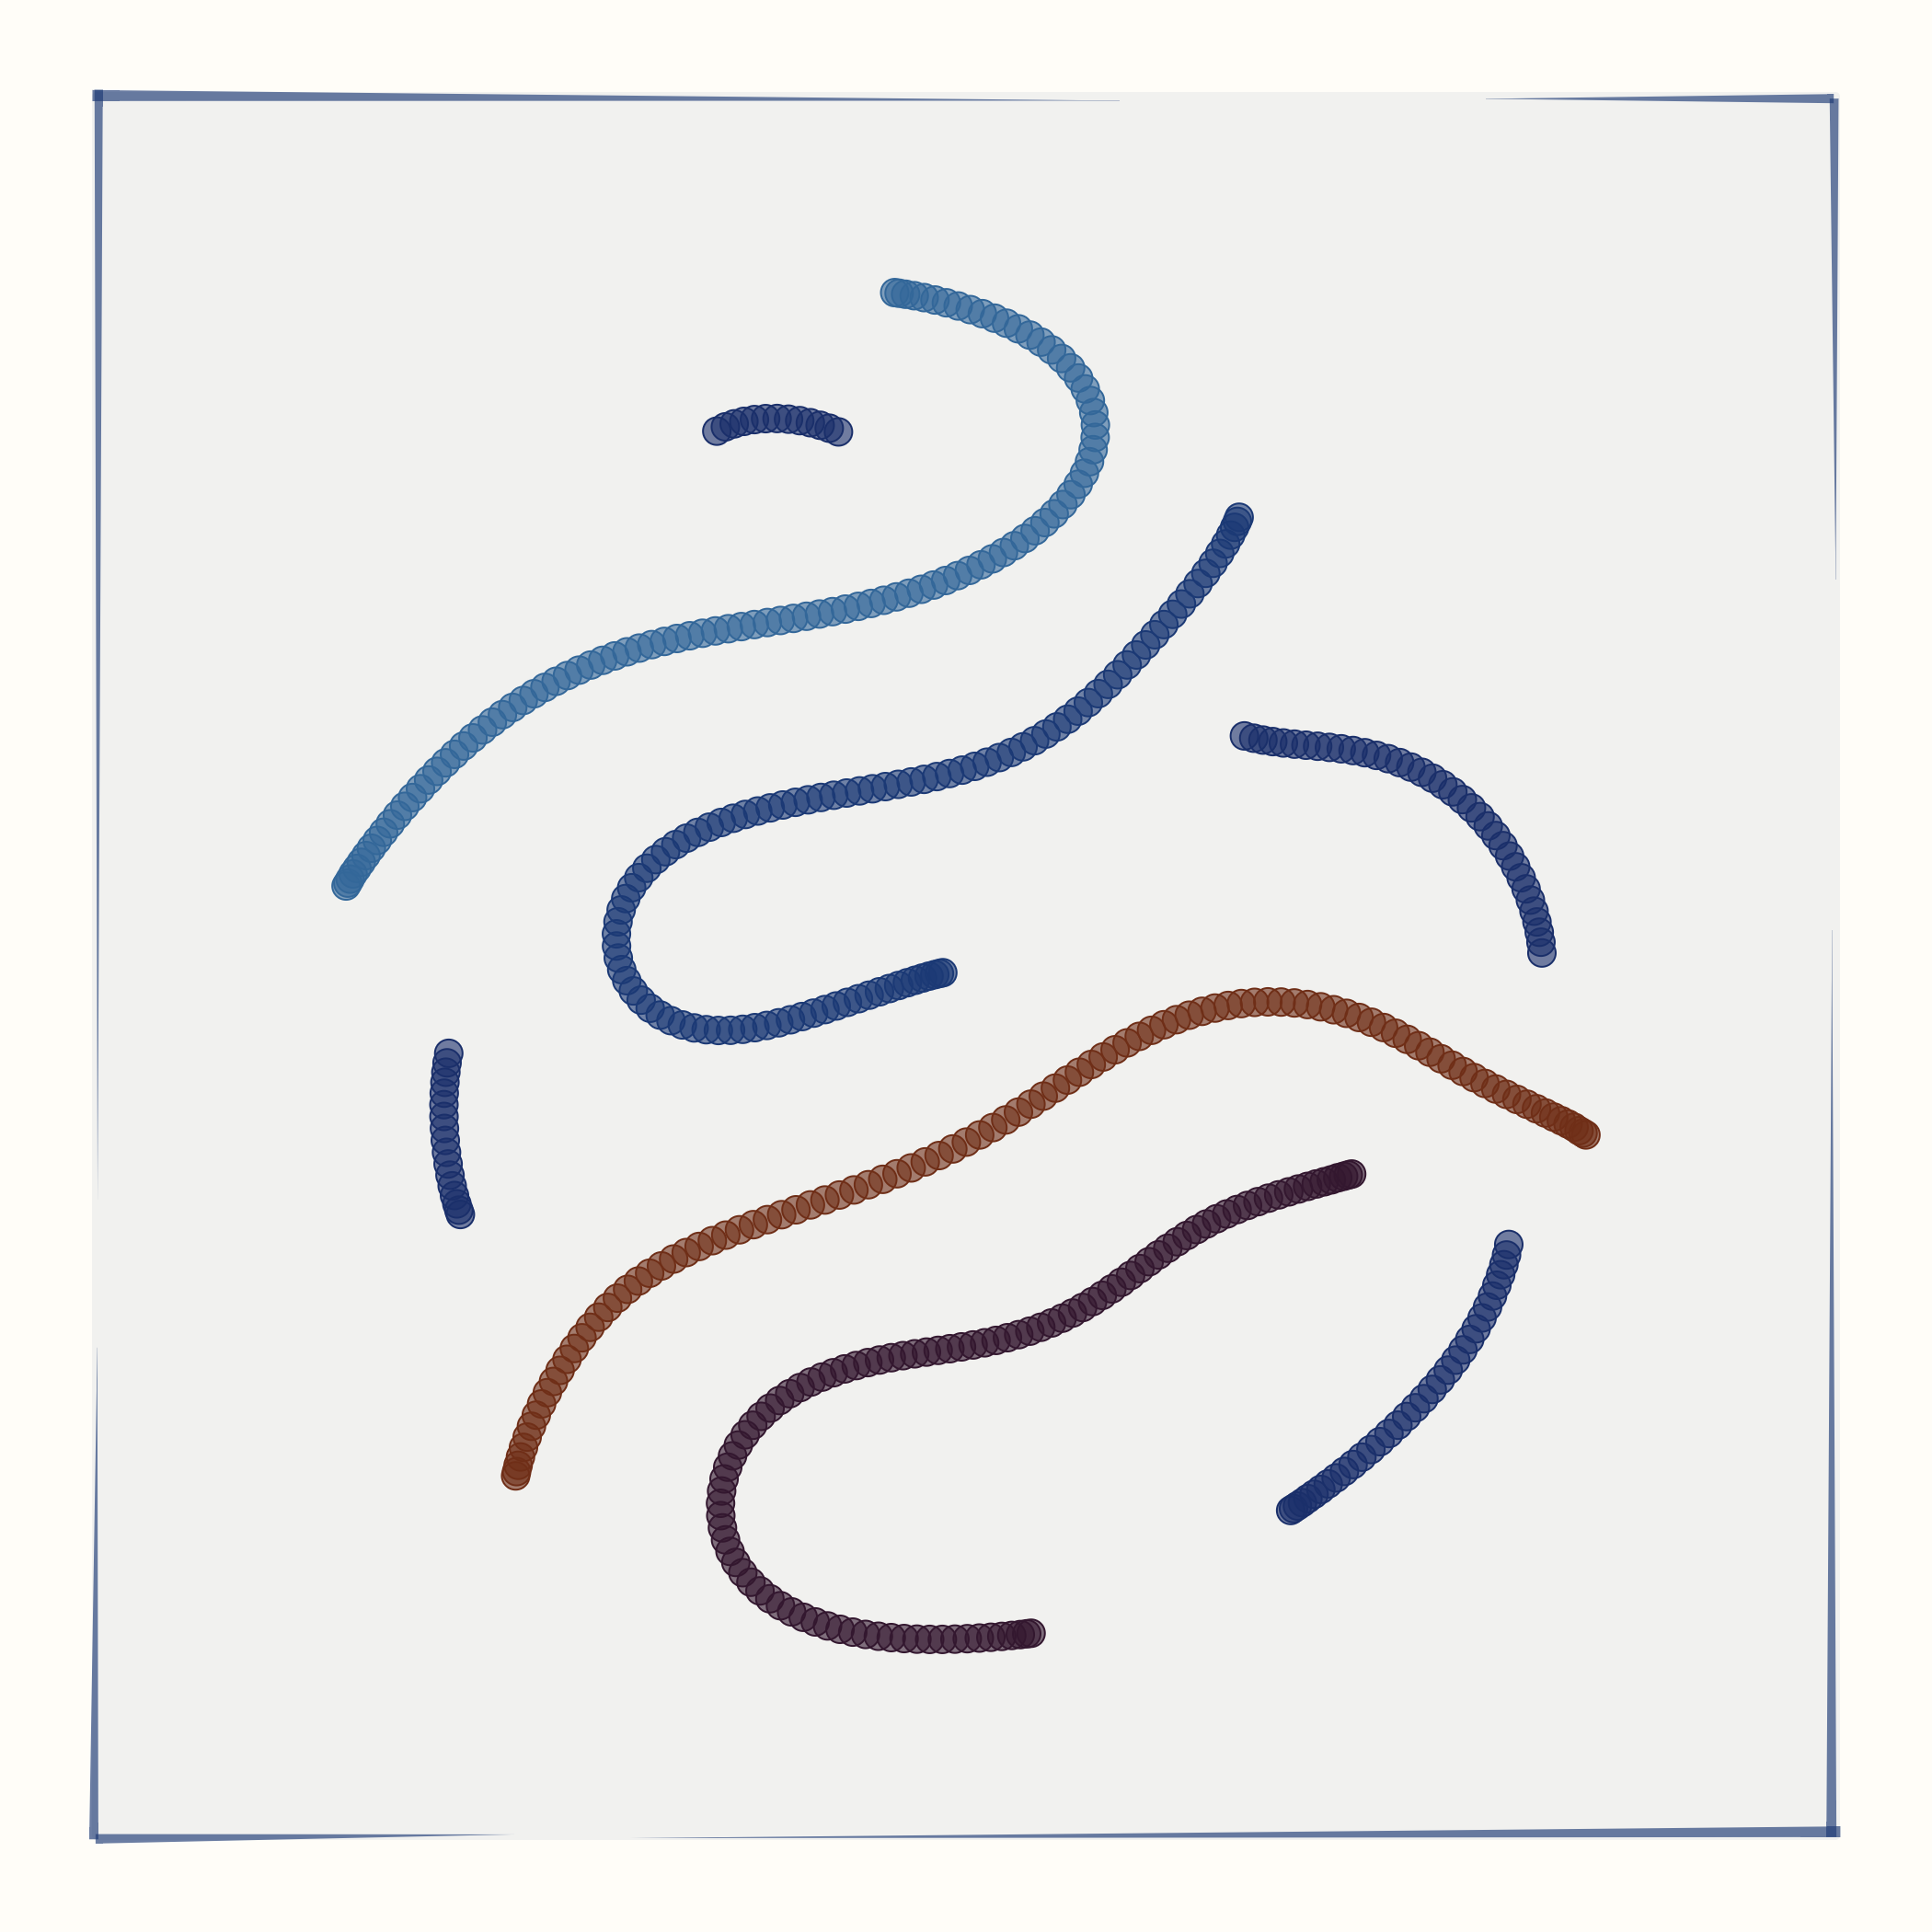
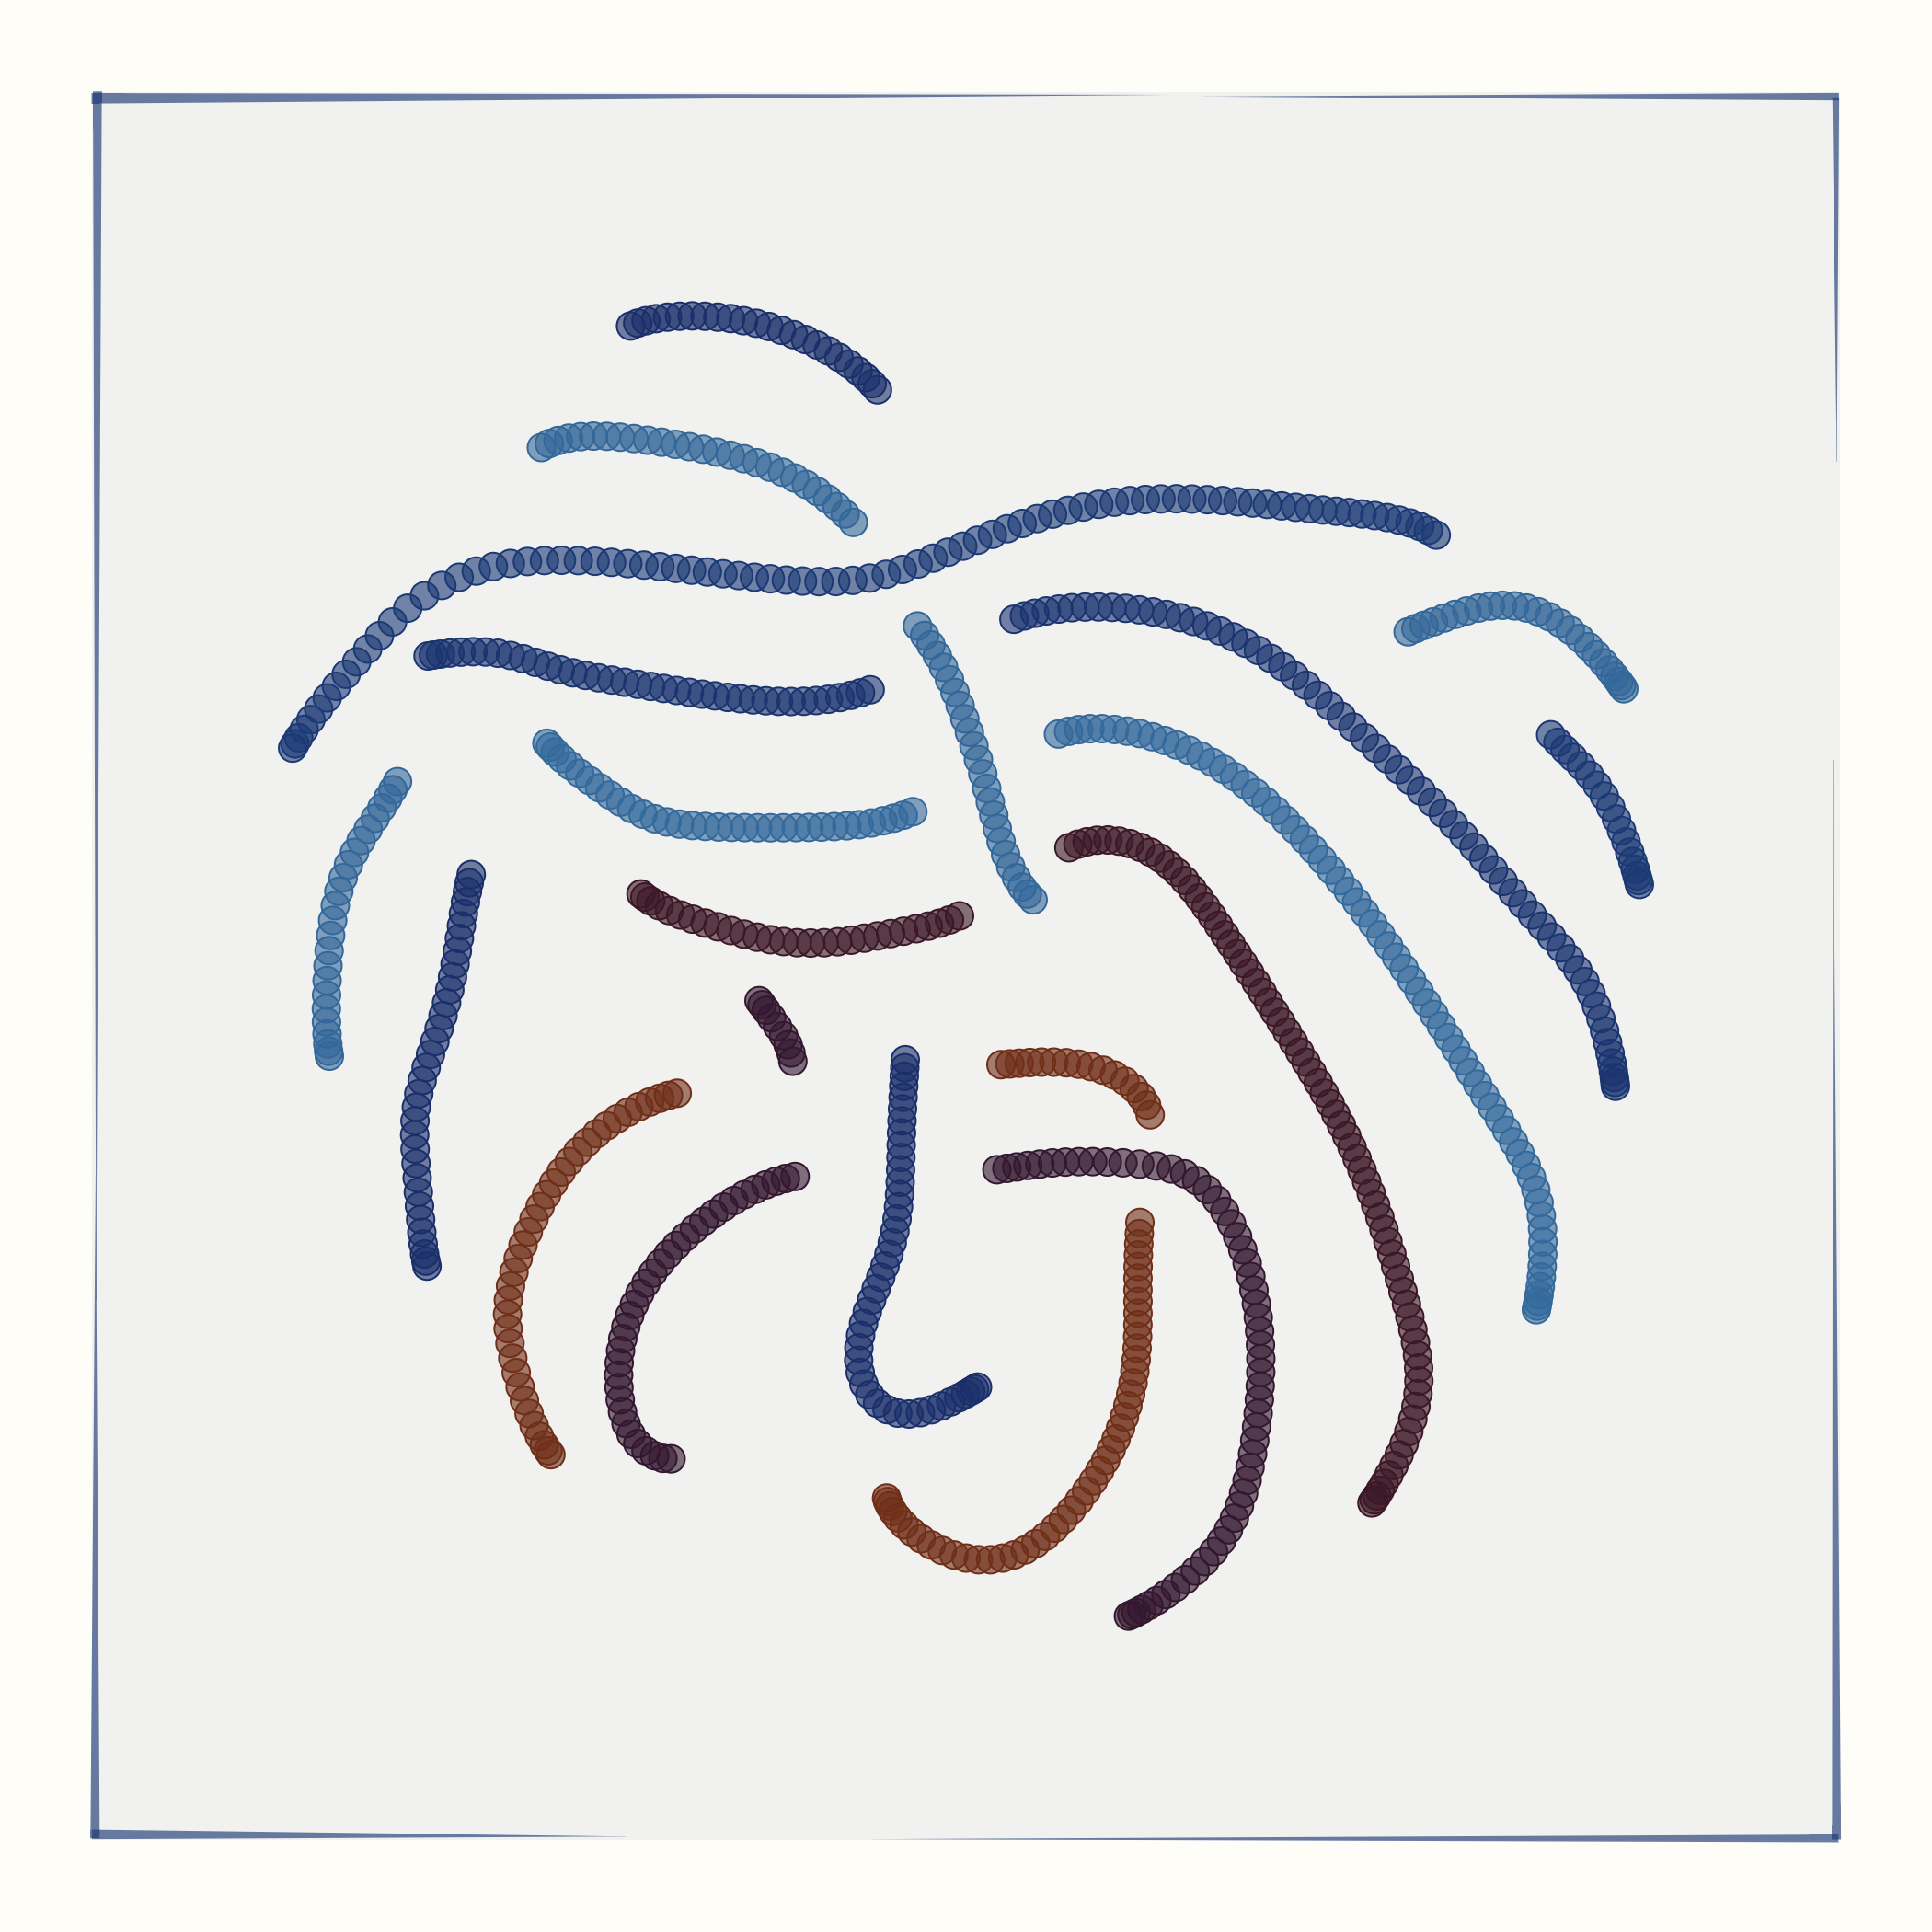
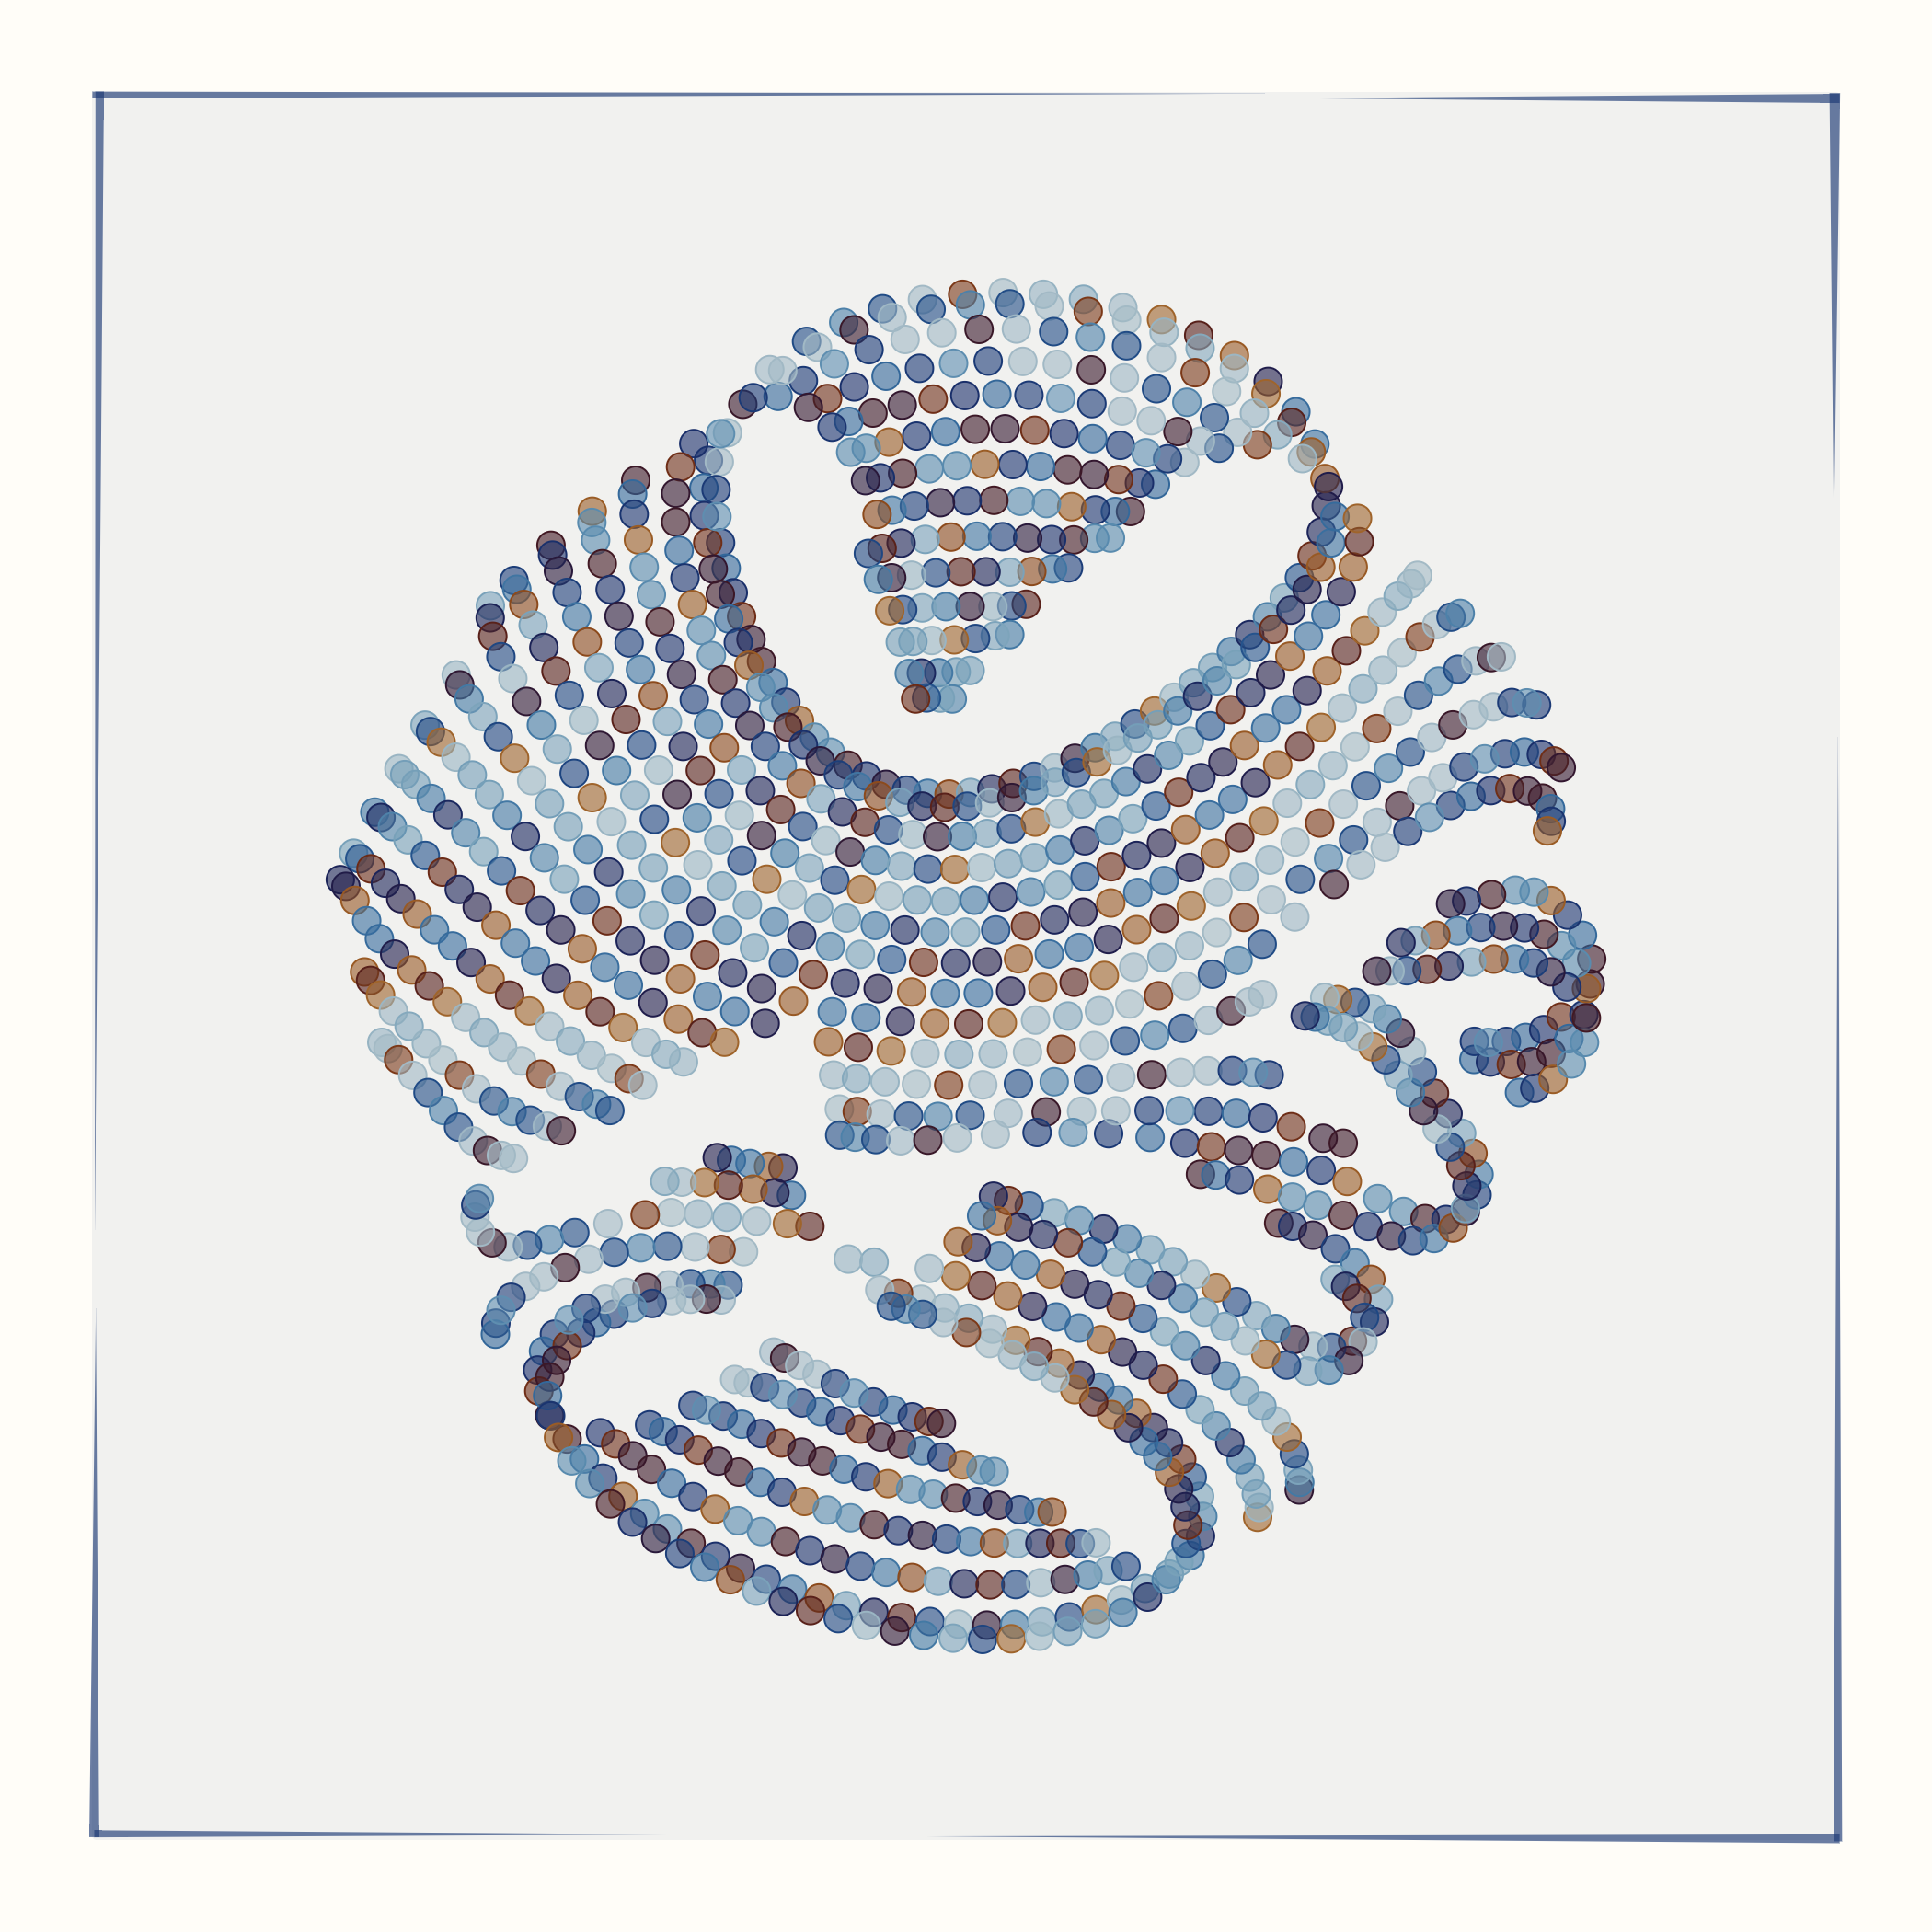
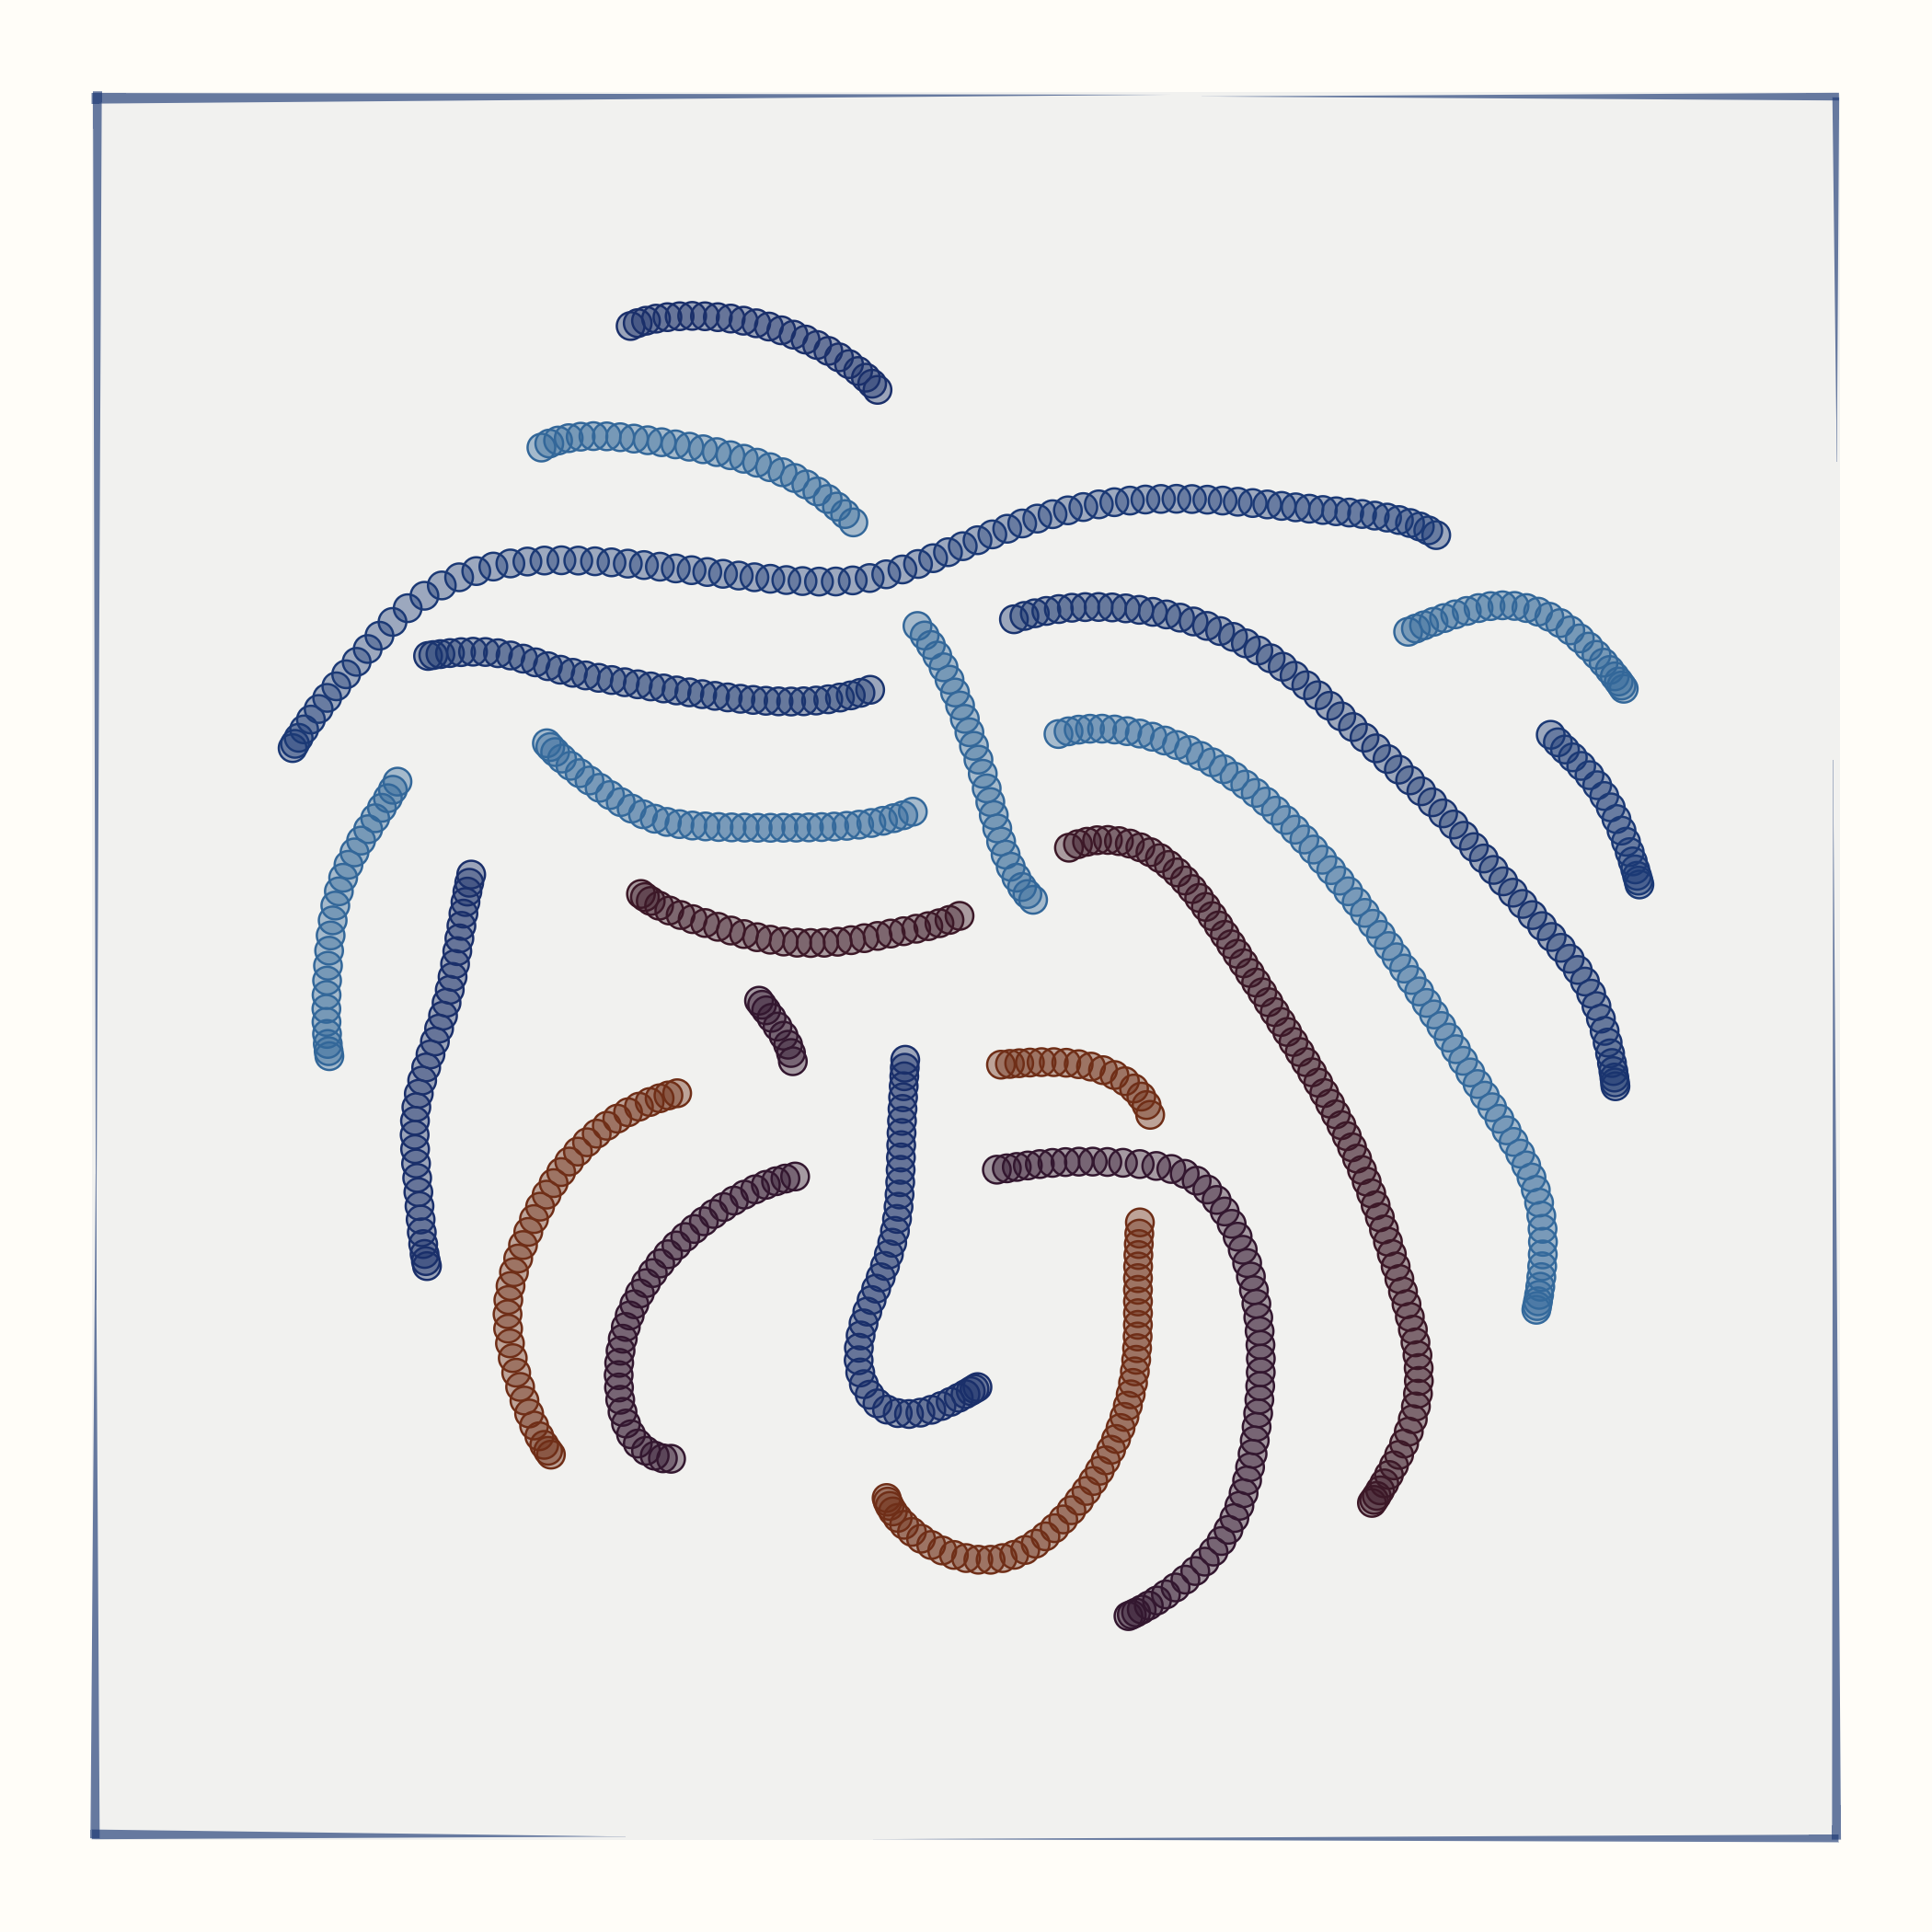
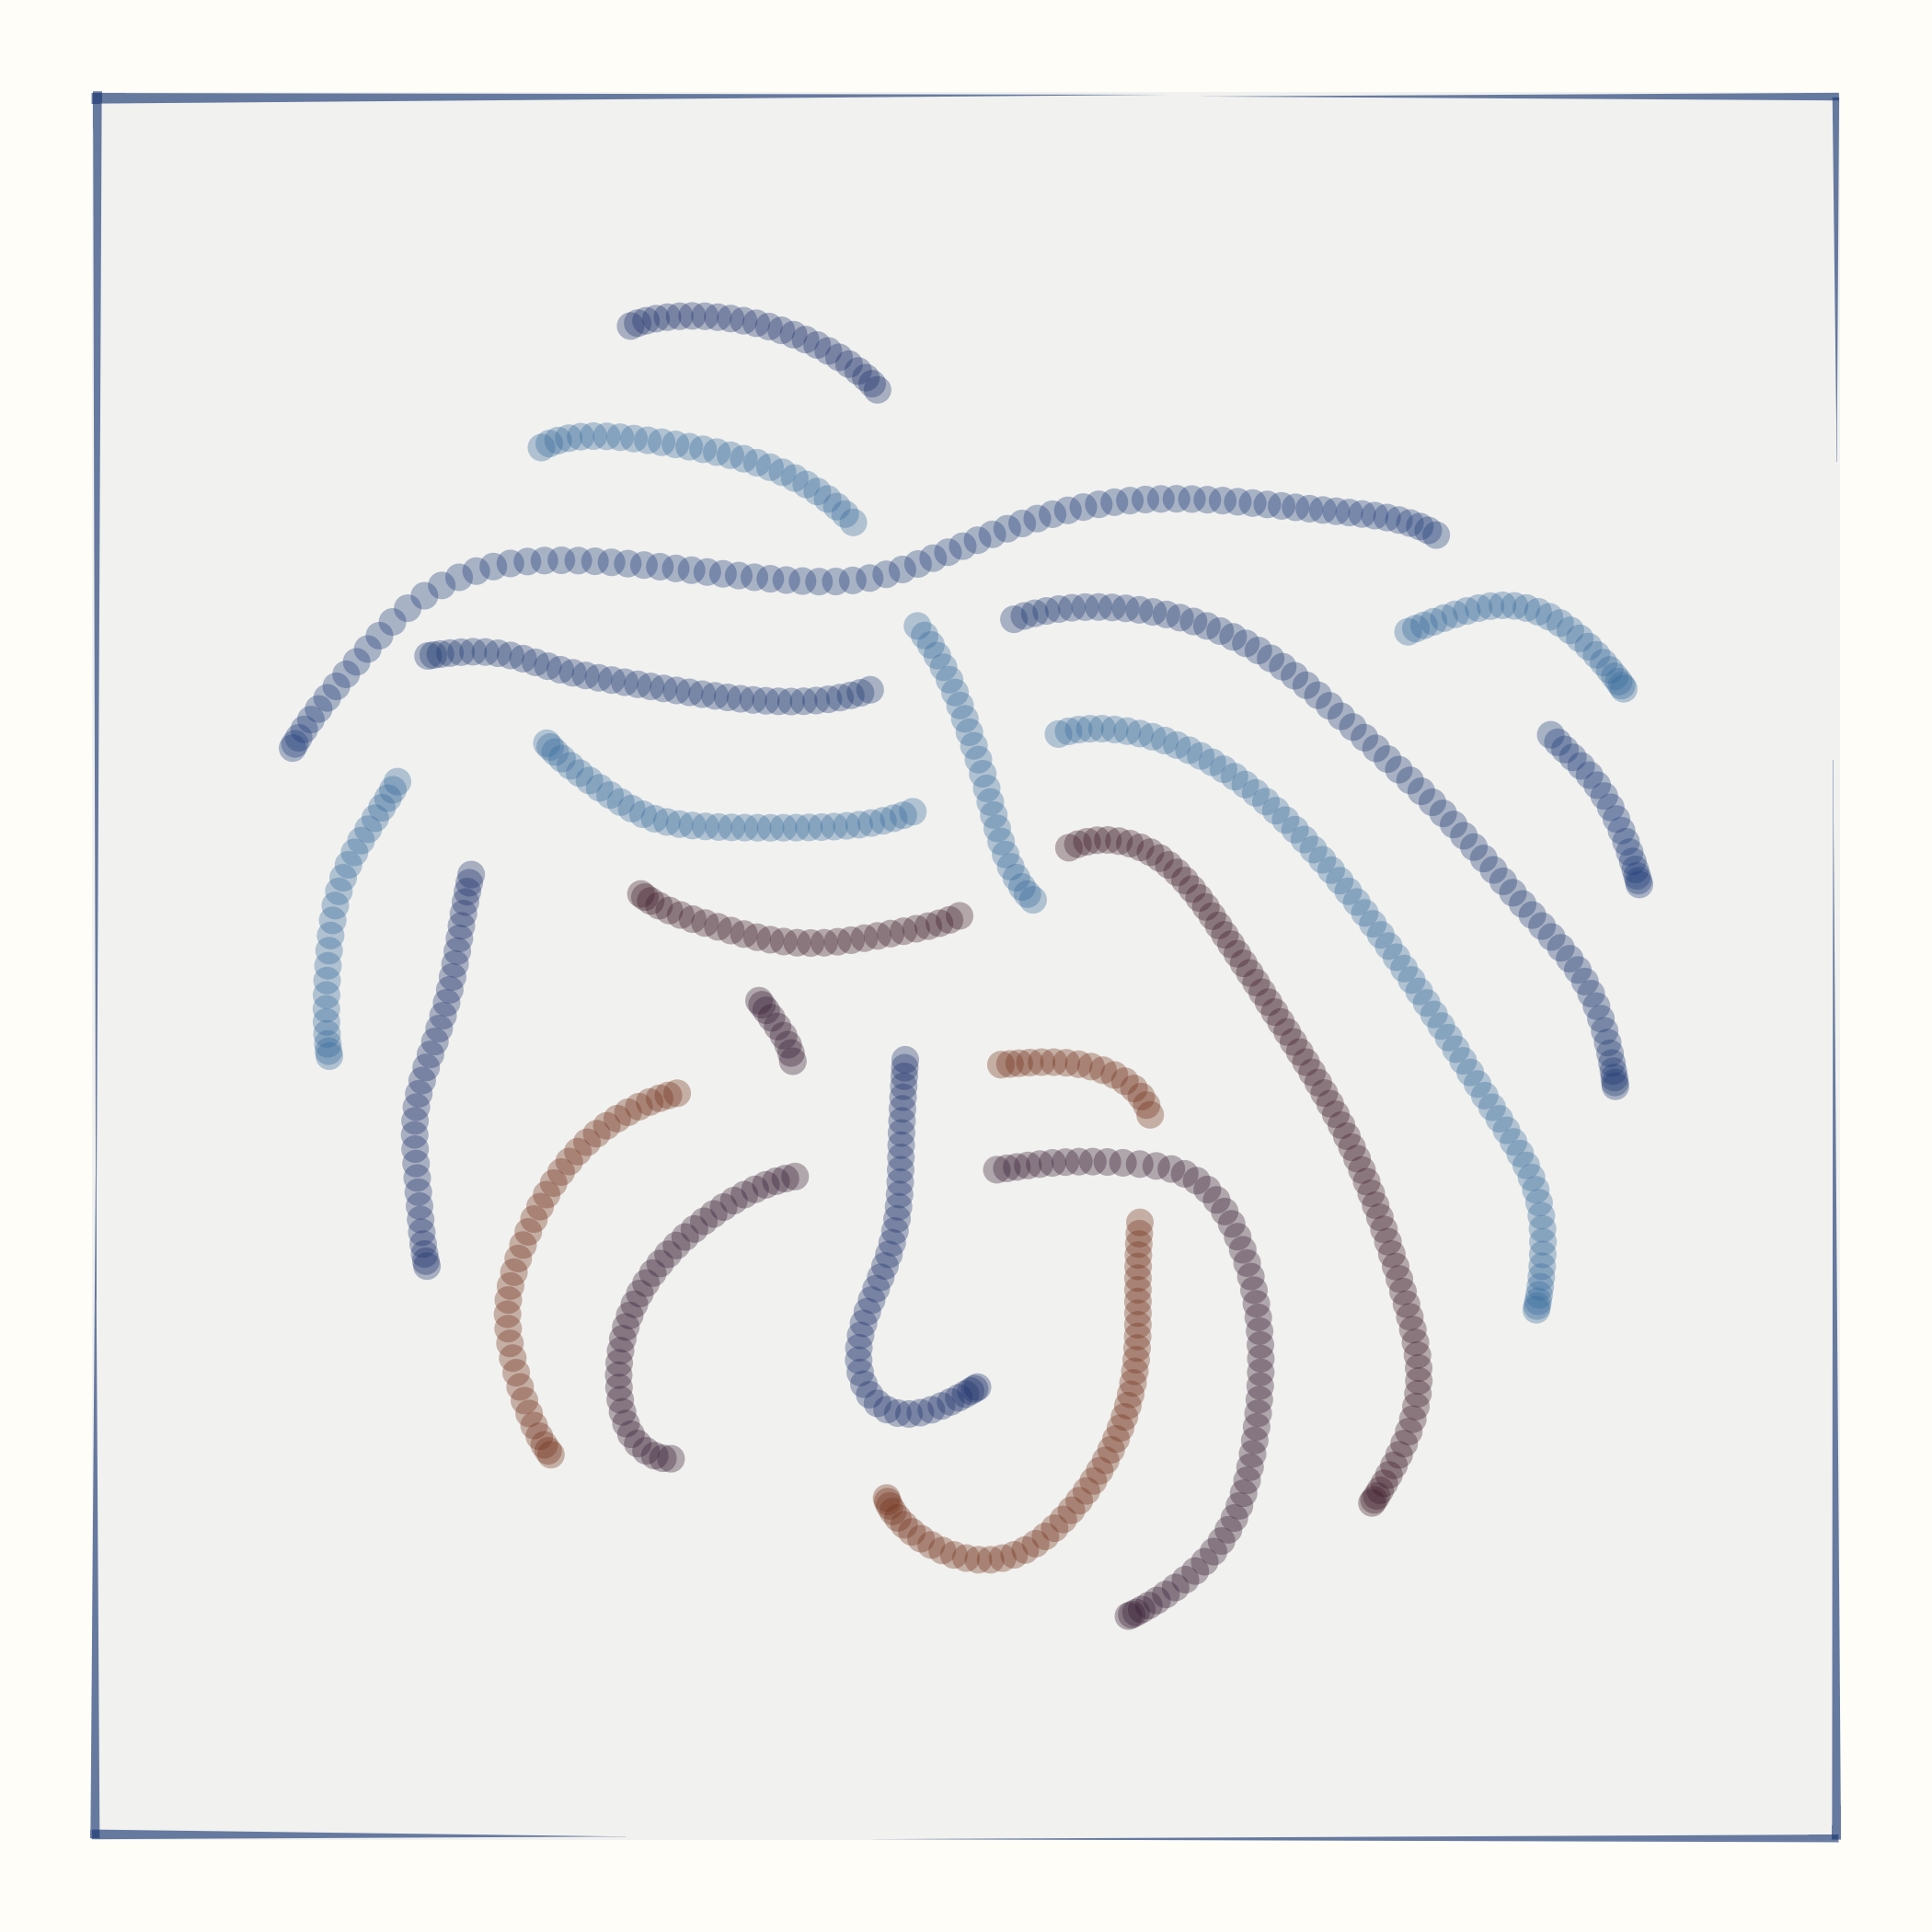
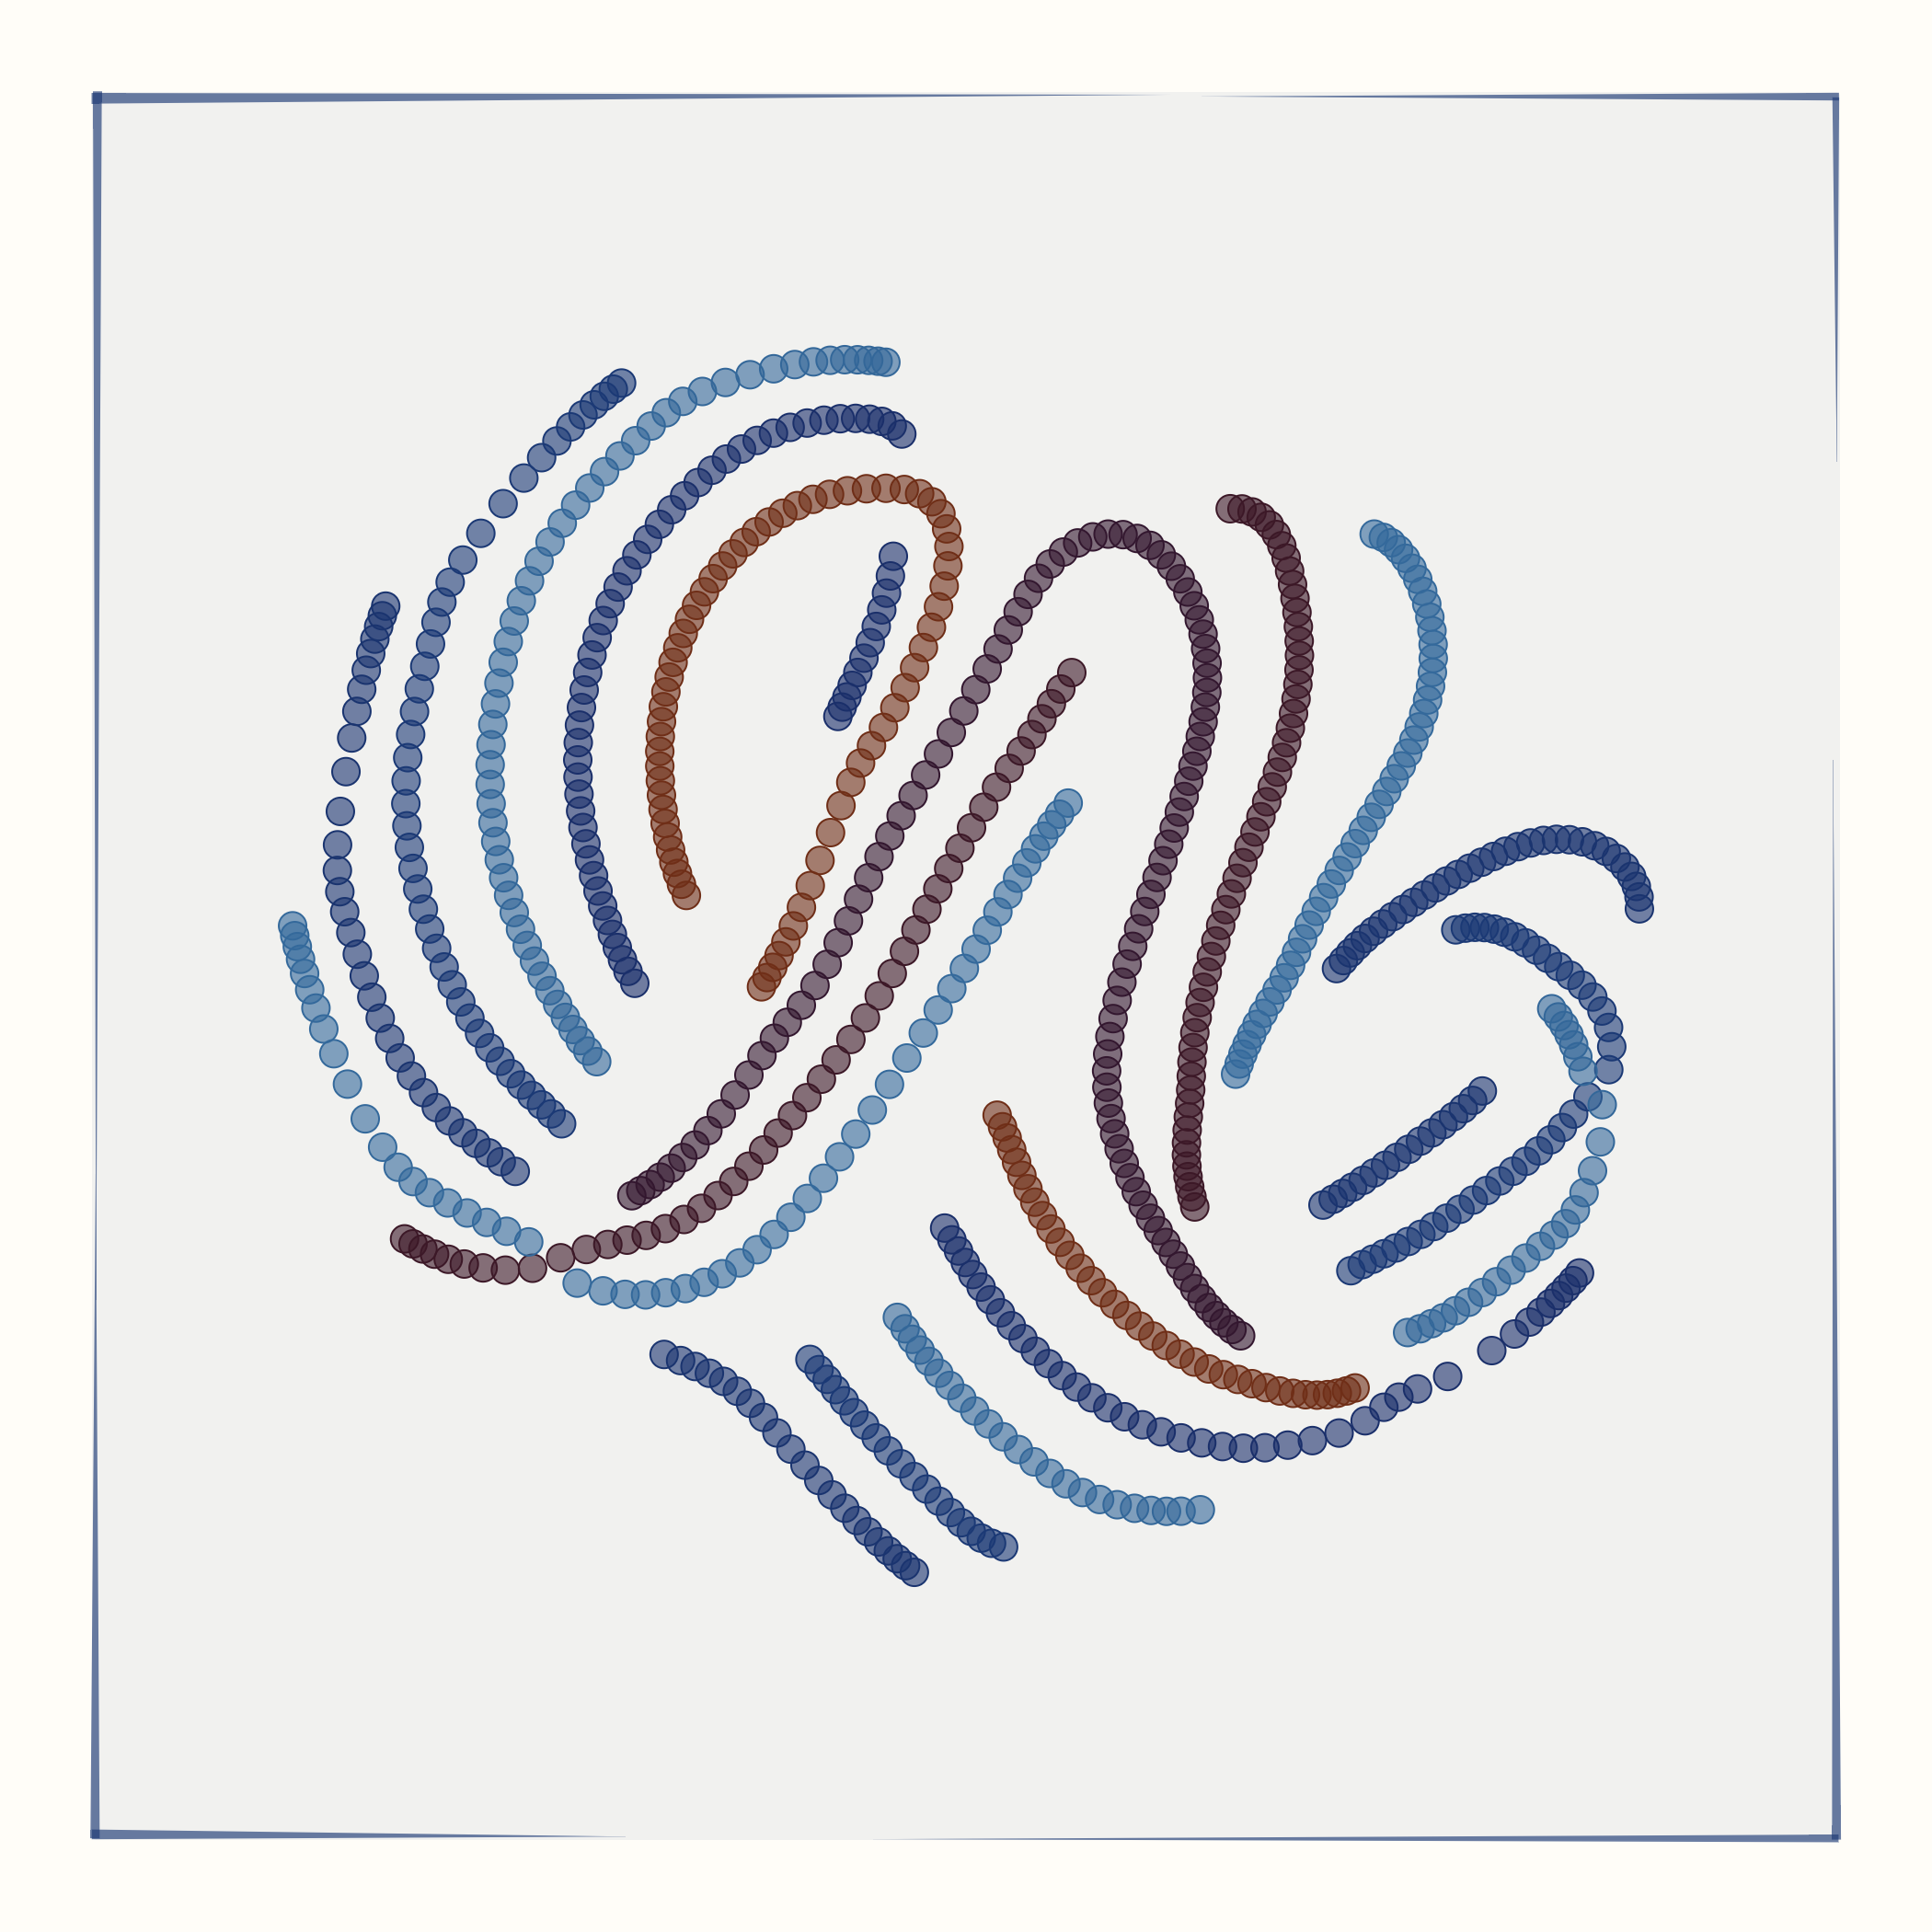
All individual panels of each artwork are generated following the same principle: I generate an array of 2d points to be used as input data, feed this data into the t-SNE algorithm, and then display the output data on a 2d plane. t-SNE tends to conserve local structure in the input data and destroy longer-range relationship. Consequently, some aspects of the input data matter for the resulting output. For this series, I have used five different input data types: spirals, rings, waves, a grid, or crossed rings. For every individual artwork, the exact input data depends on a variety of random parameters. For example, the grid can have a larger or smaller number of horizontal and vertical stripes. Similarly, the rings can be more or less shifted relative to each other.

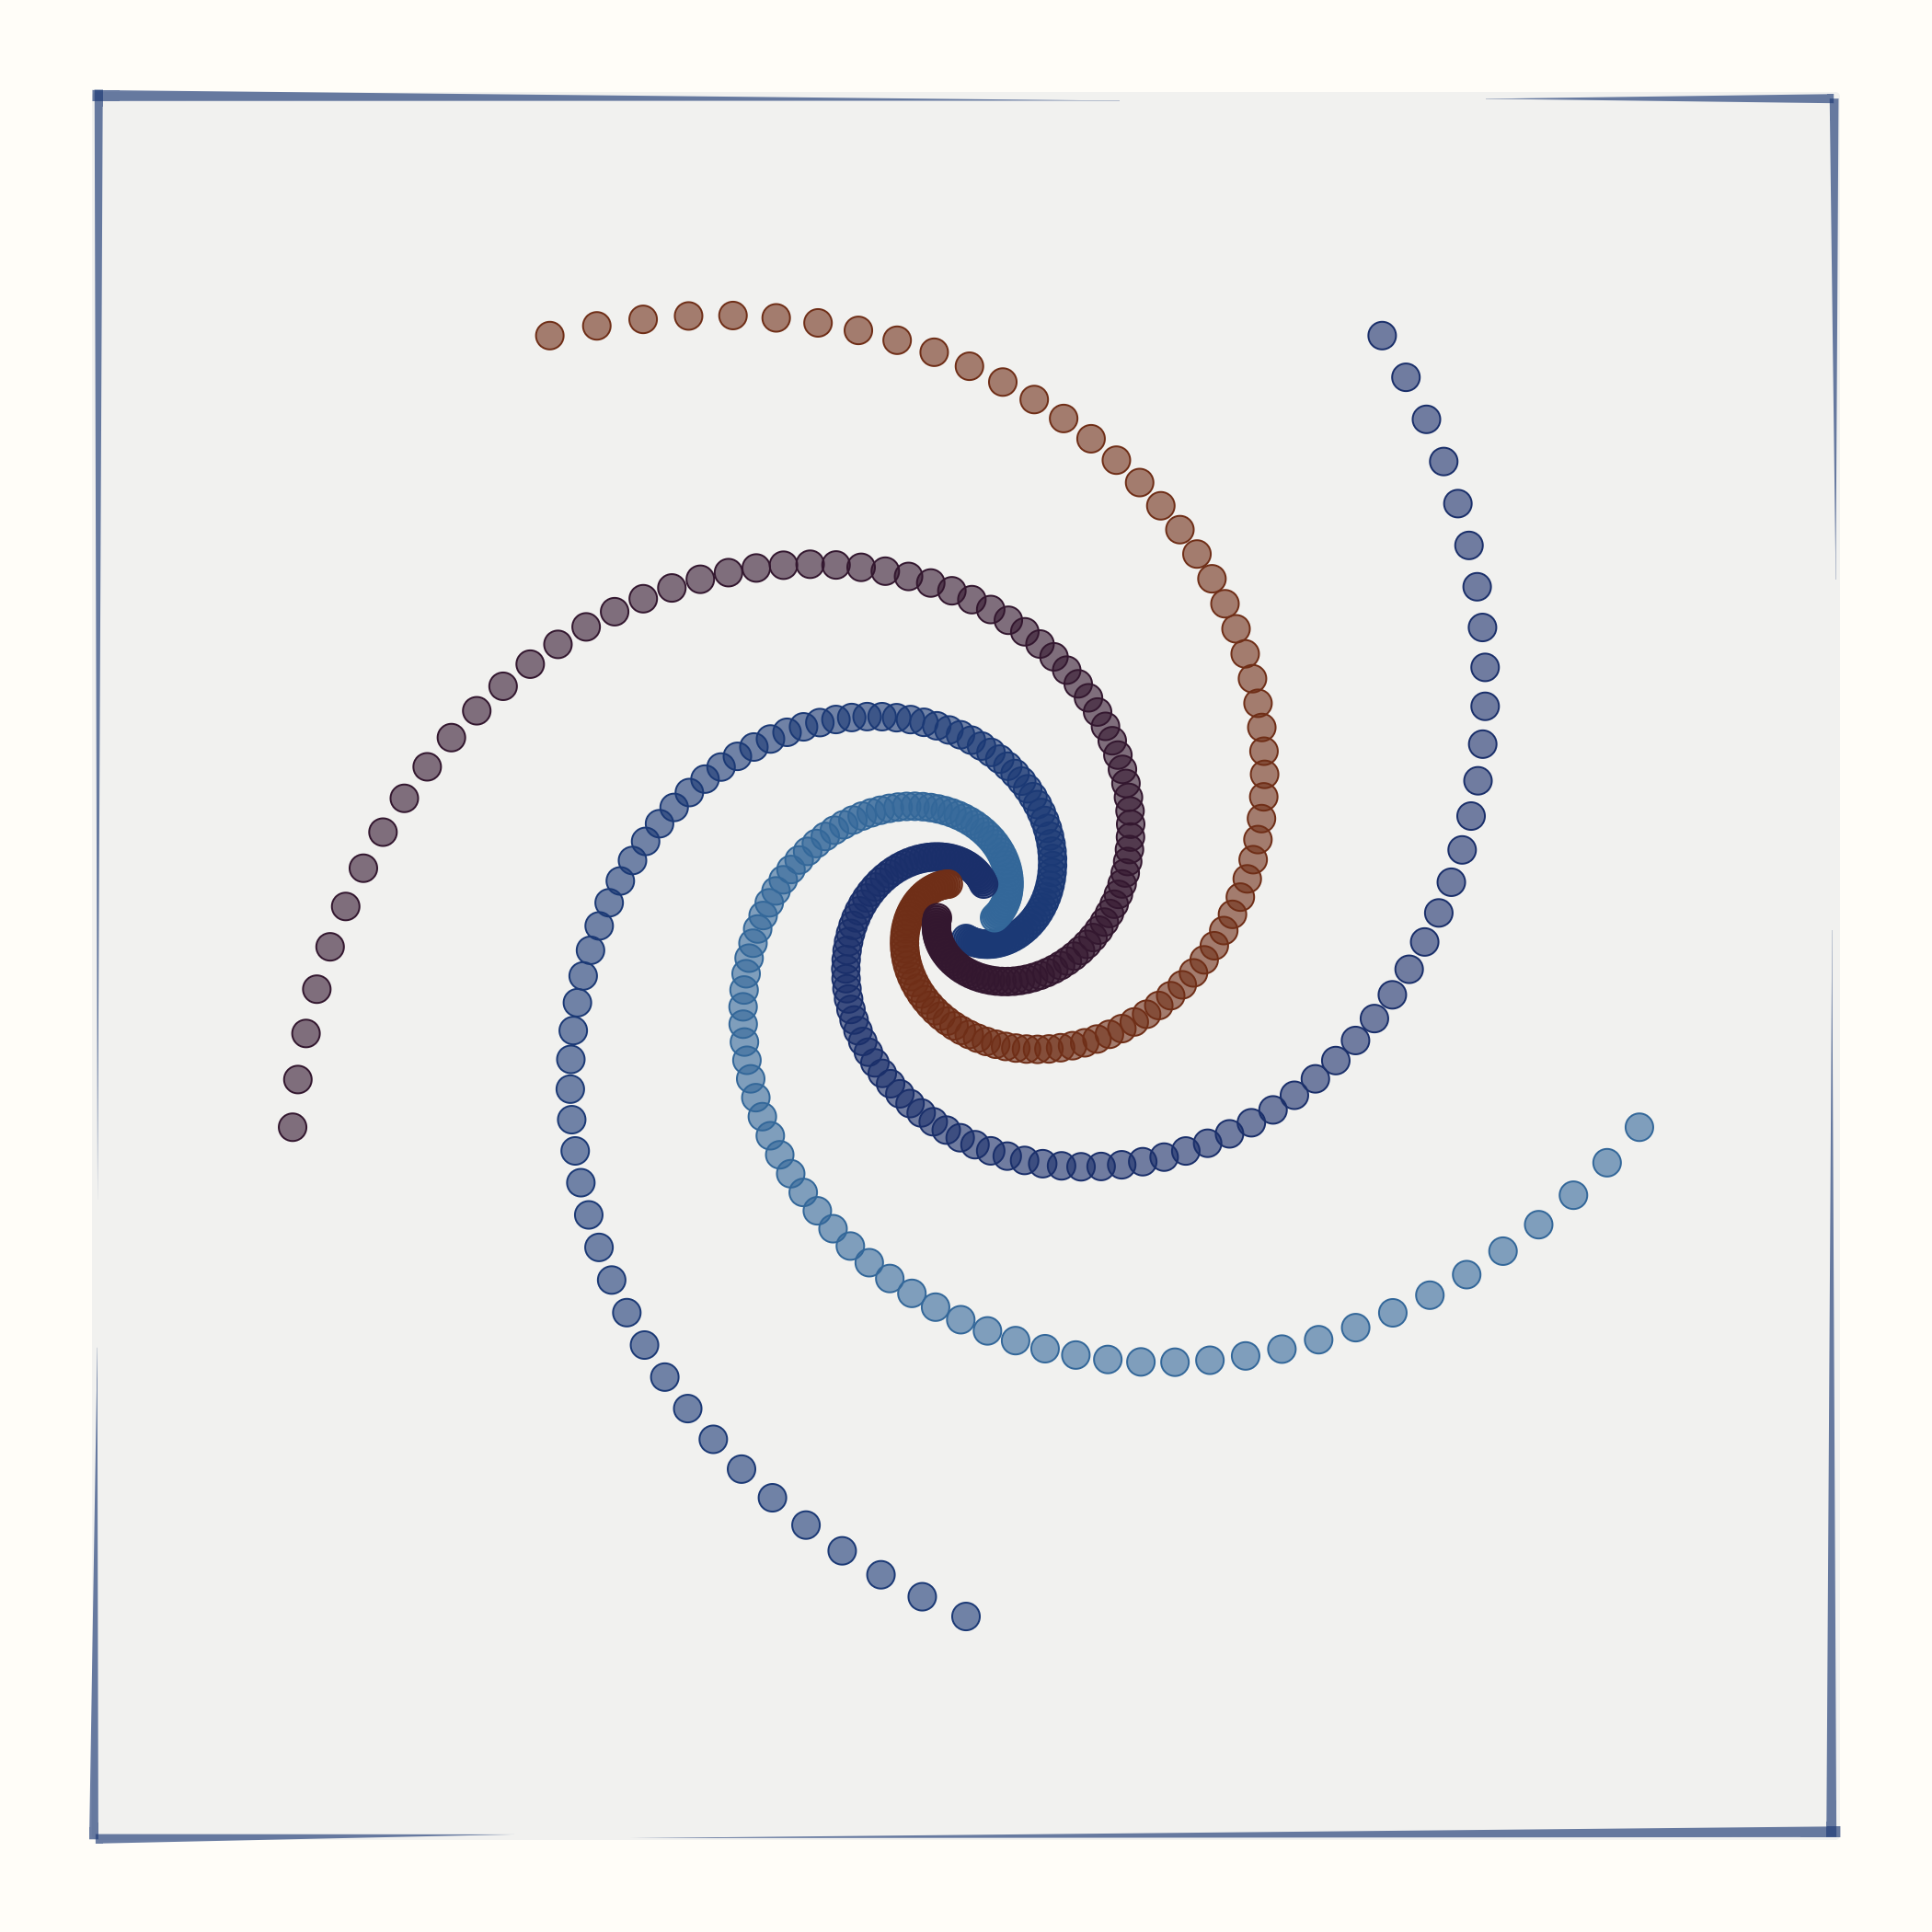
The perplexity value determines how large of a neighborhood t-SNE considers when calclating its output point arrangement. Lower perplexity values tend to generate more disrupted arrangements and higher perplexity values tend to retain more of the structure seen in the input data. In the example shown above, the input data (a set of spirals) was the exact same in all four cases.
The number of groups represents the number of distinct sets of points in the input data. For example, if the input data is of type spirals, then the number of groups determines the number of spiral arms. Similarly, if the input data is of type rings, the number of groups determines the number of distinct rings.


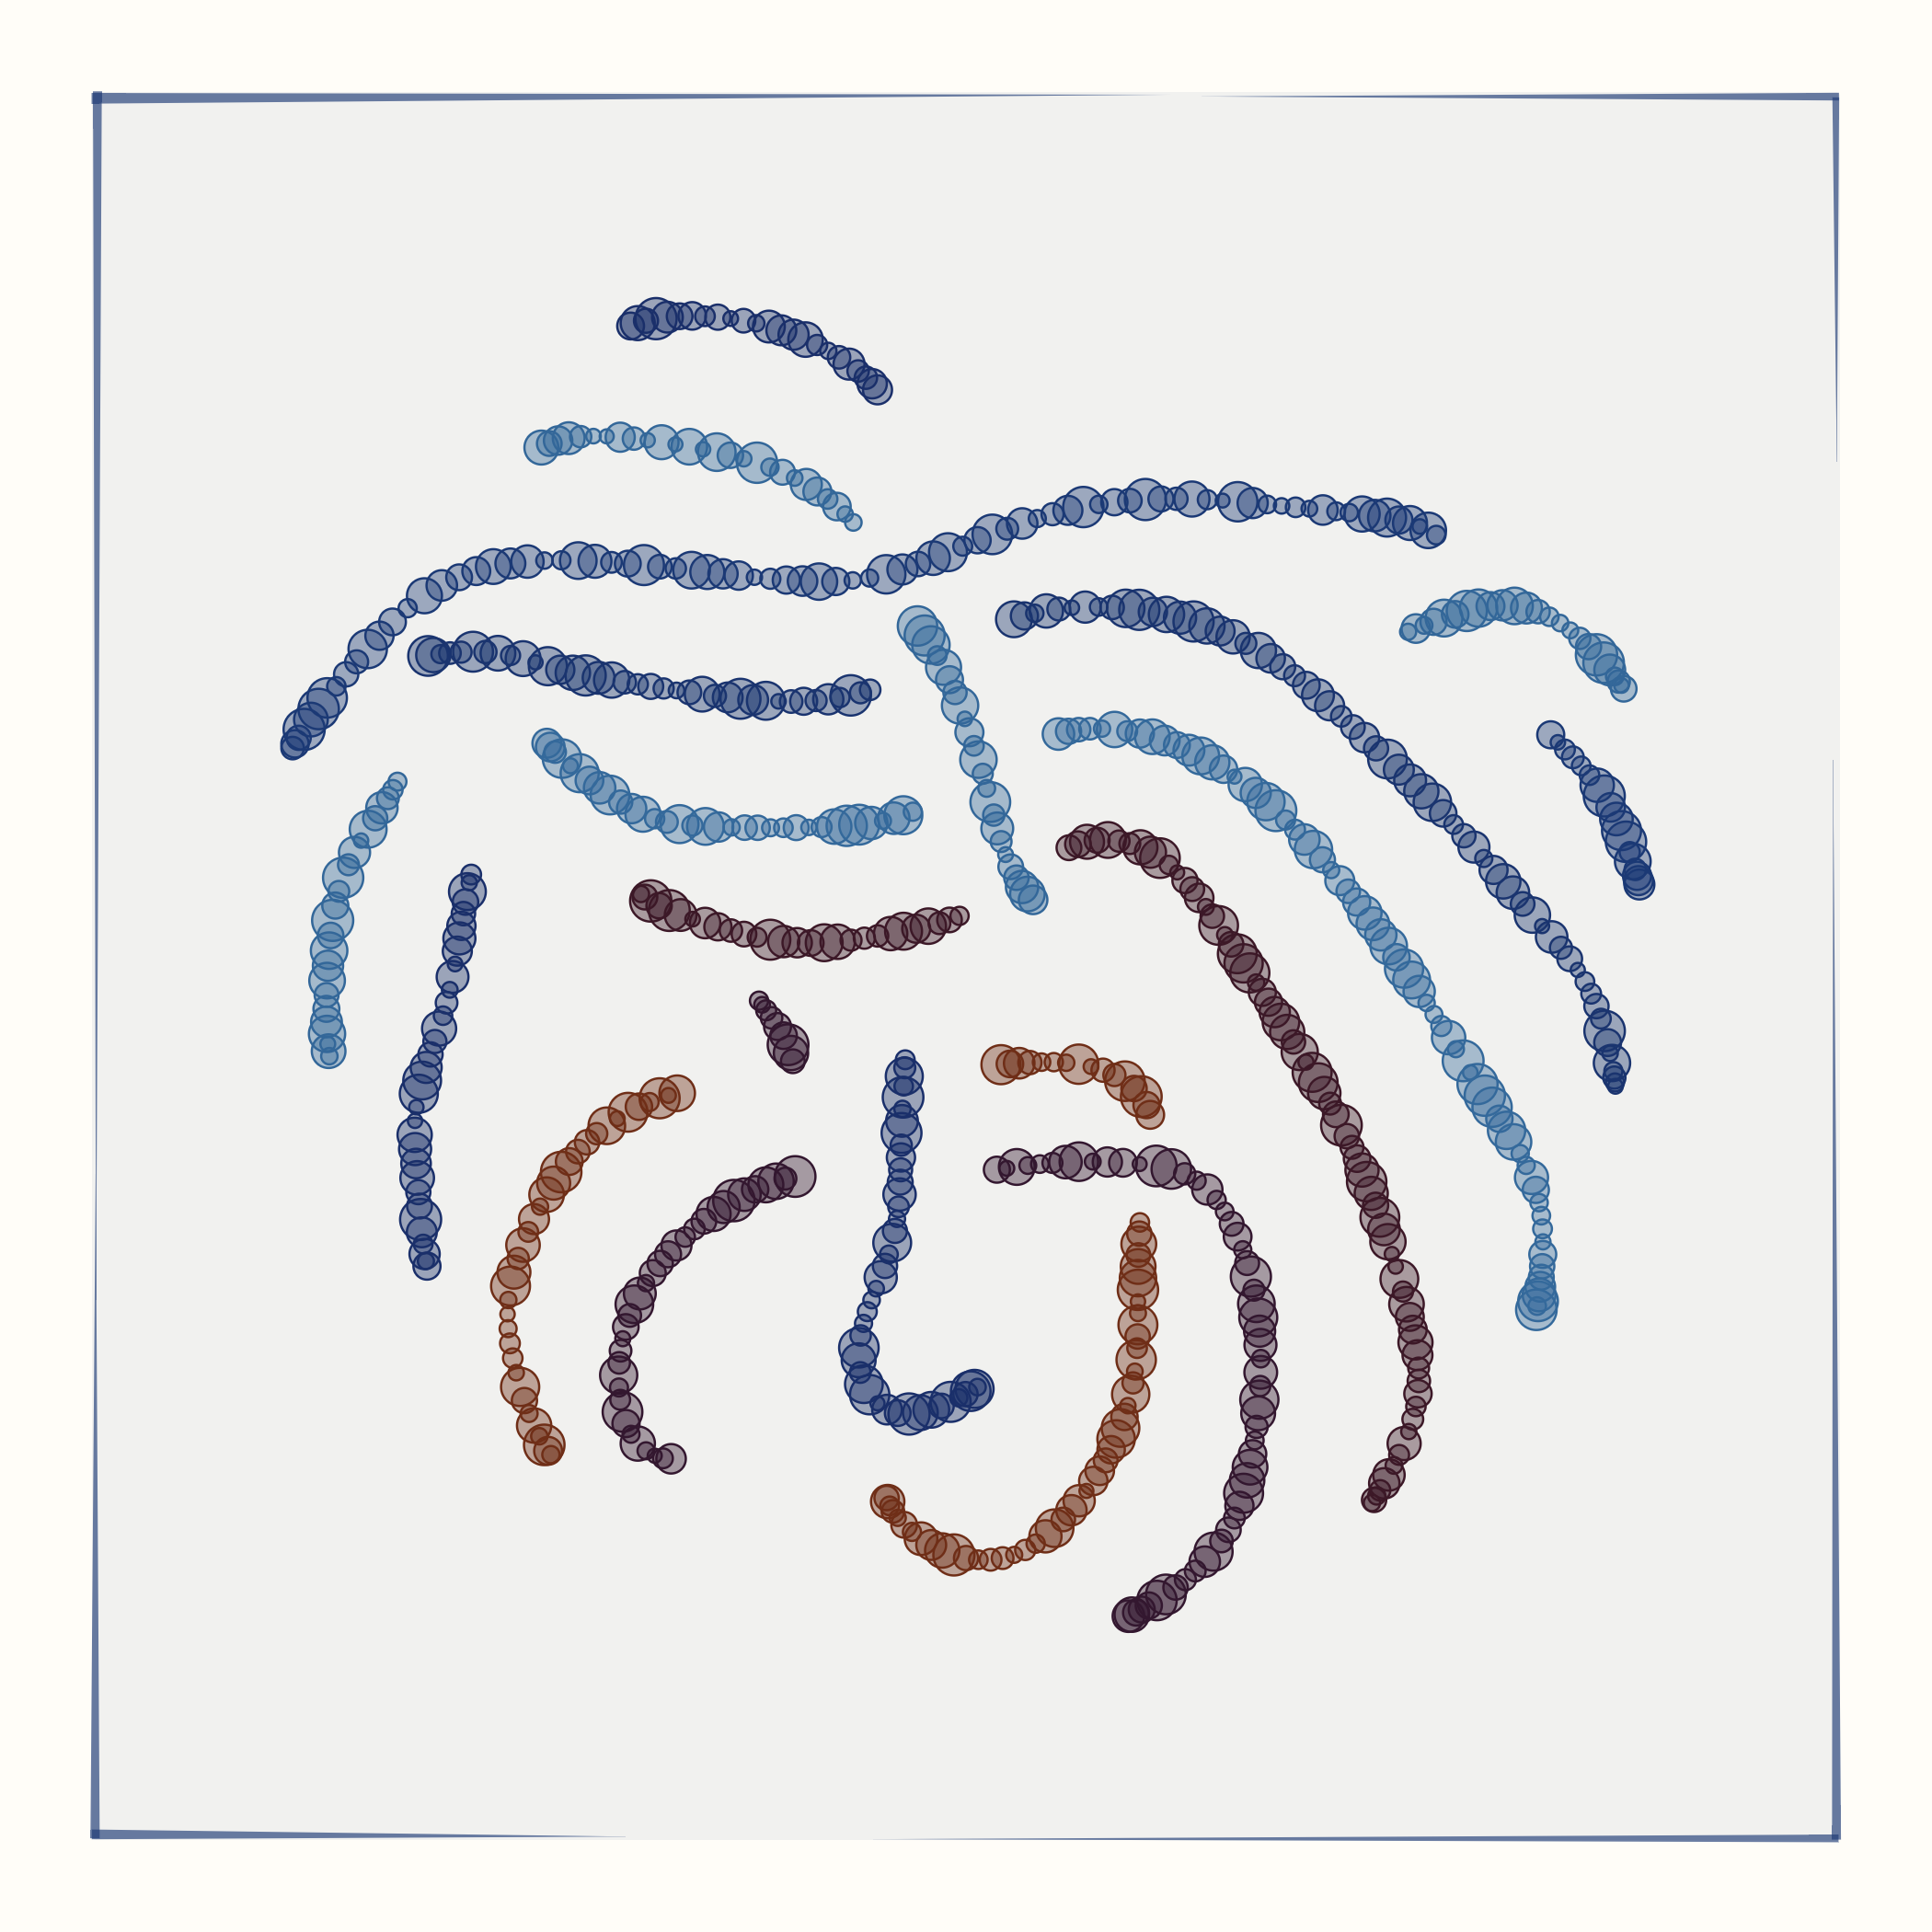
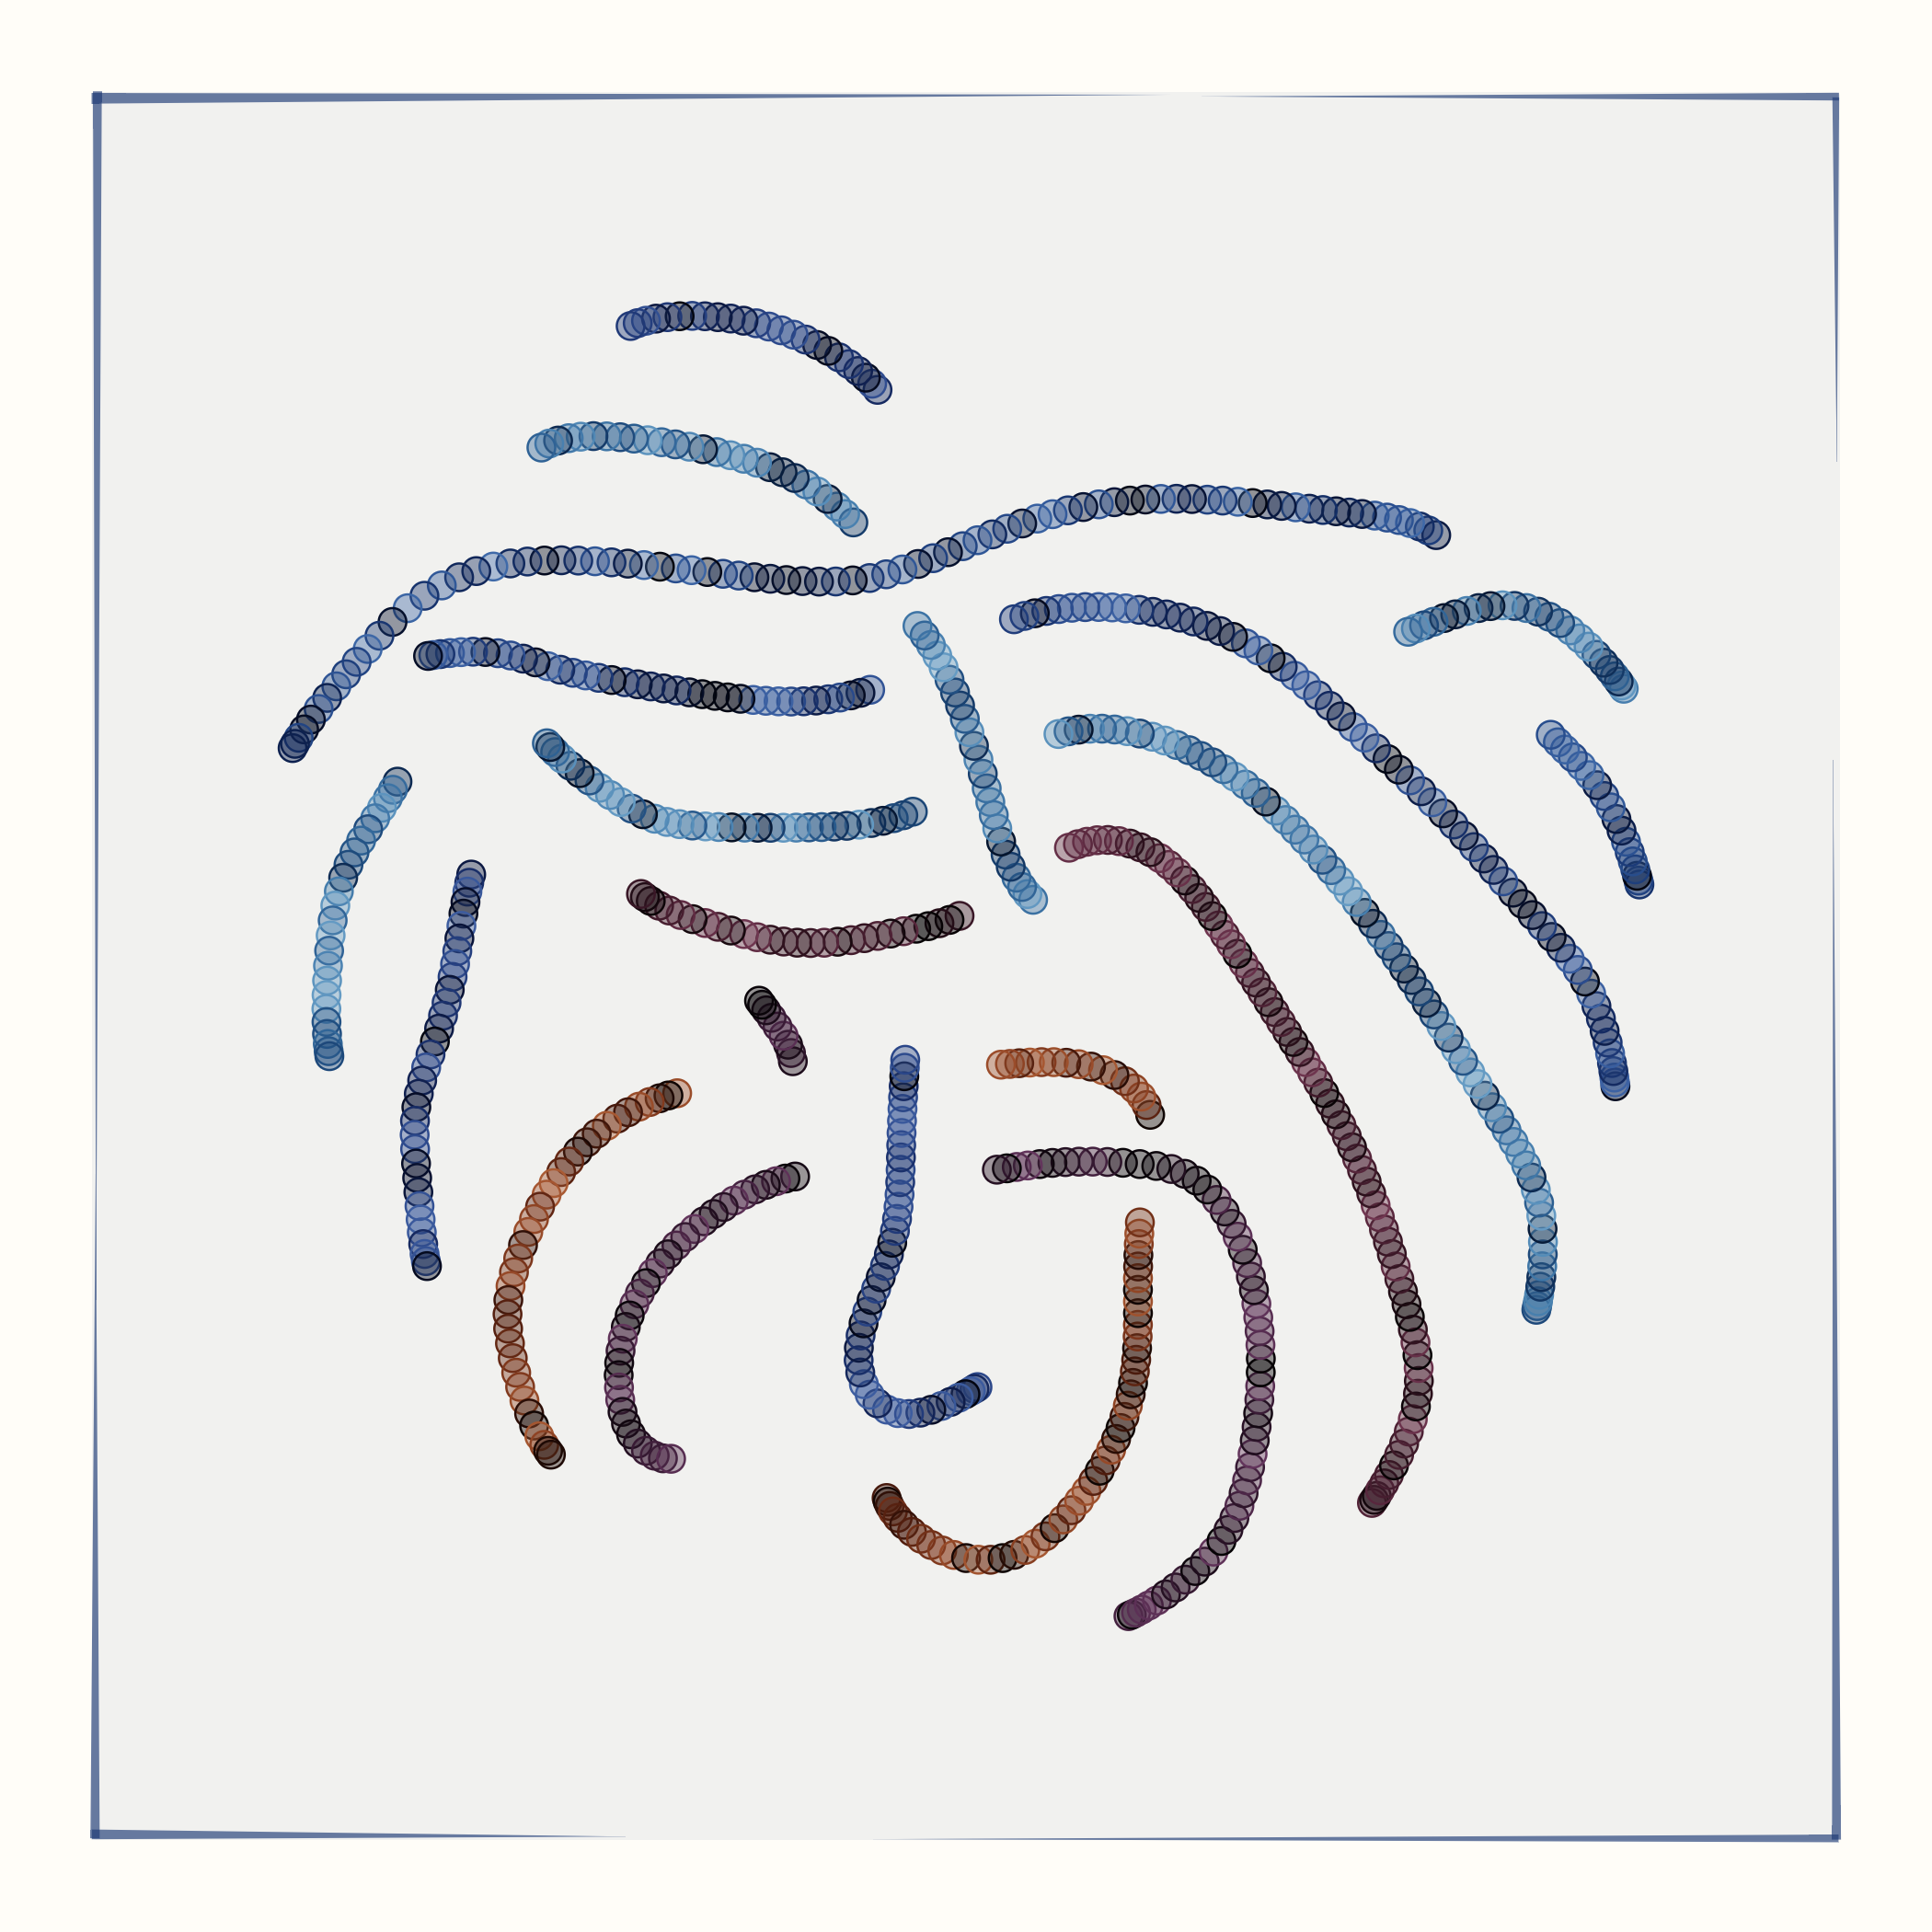
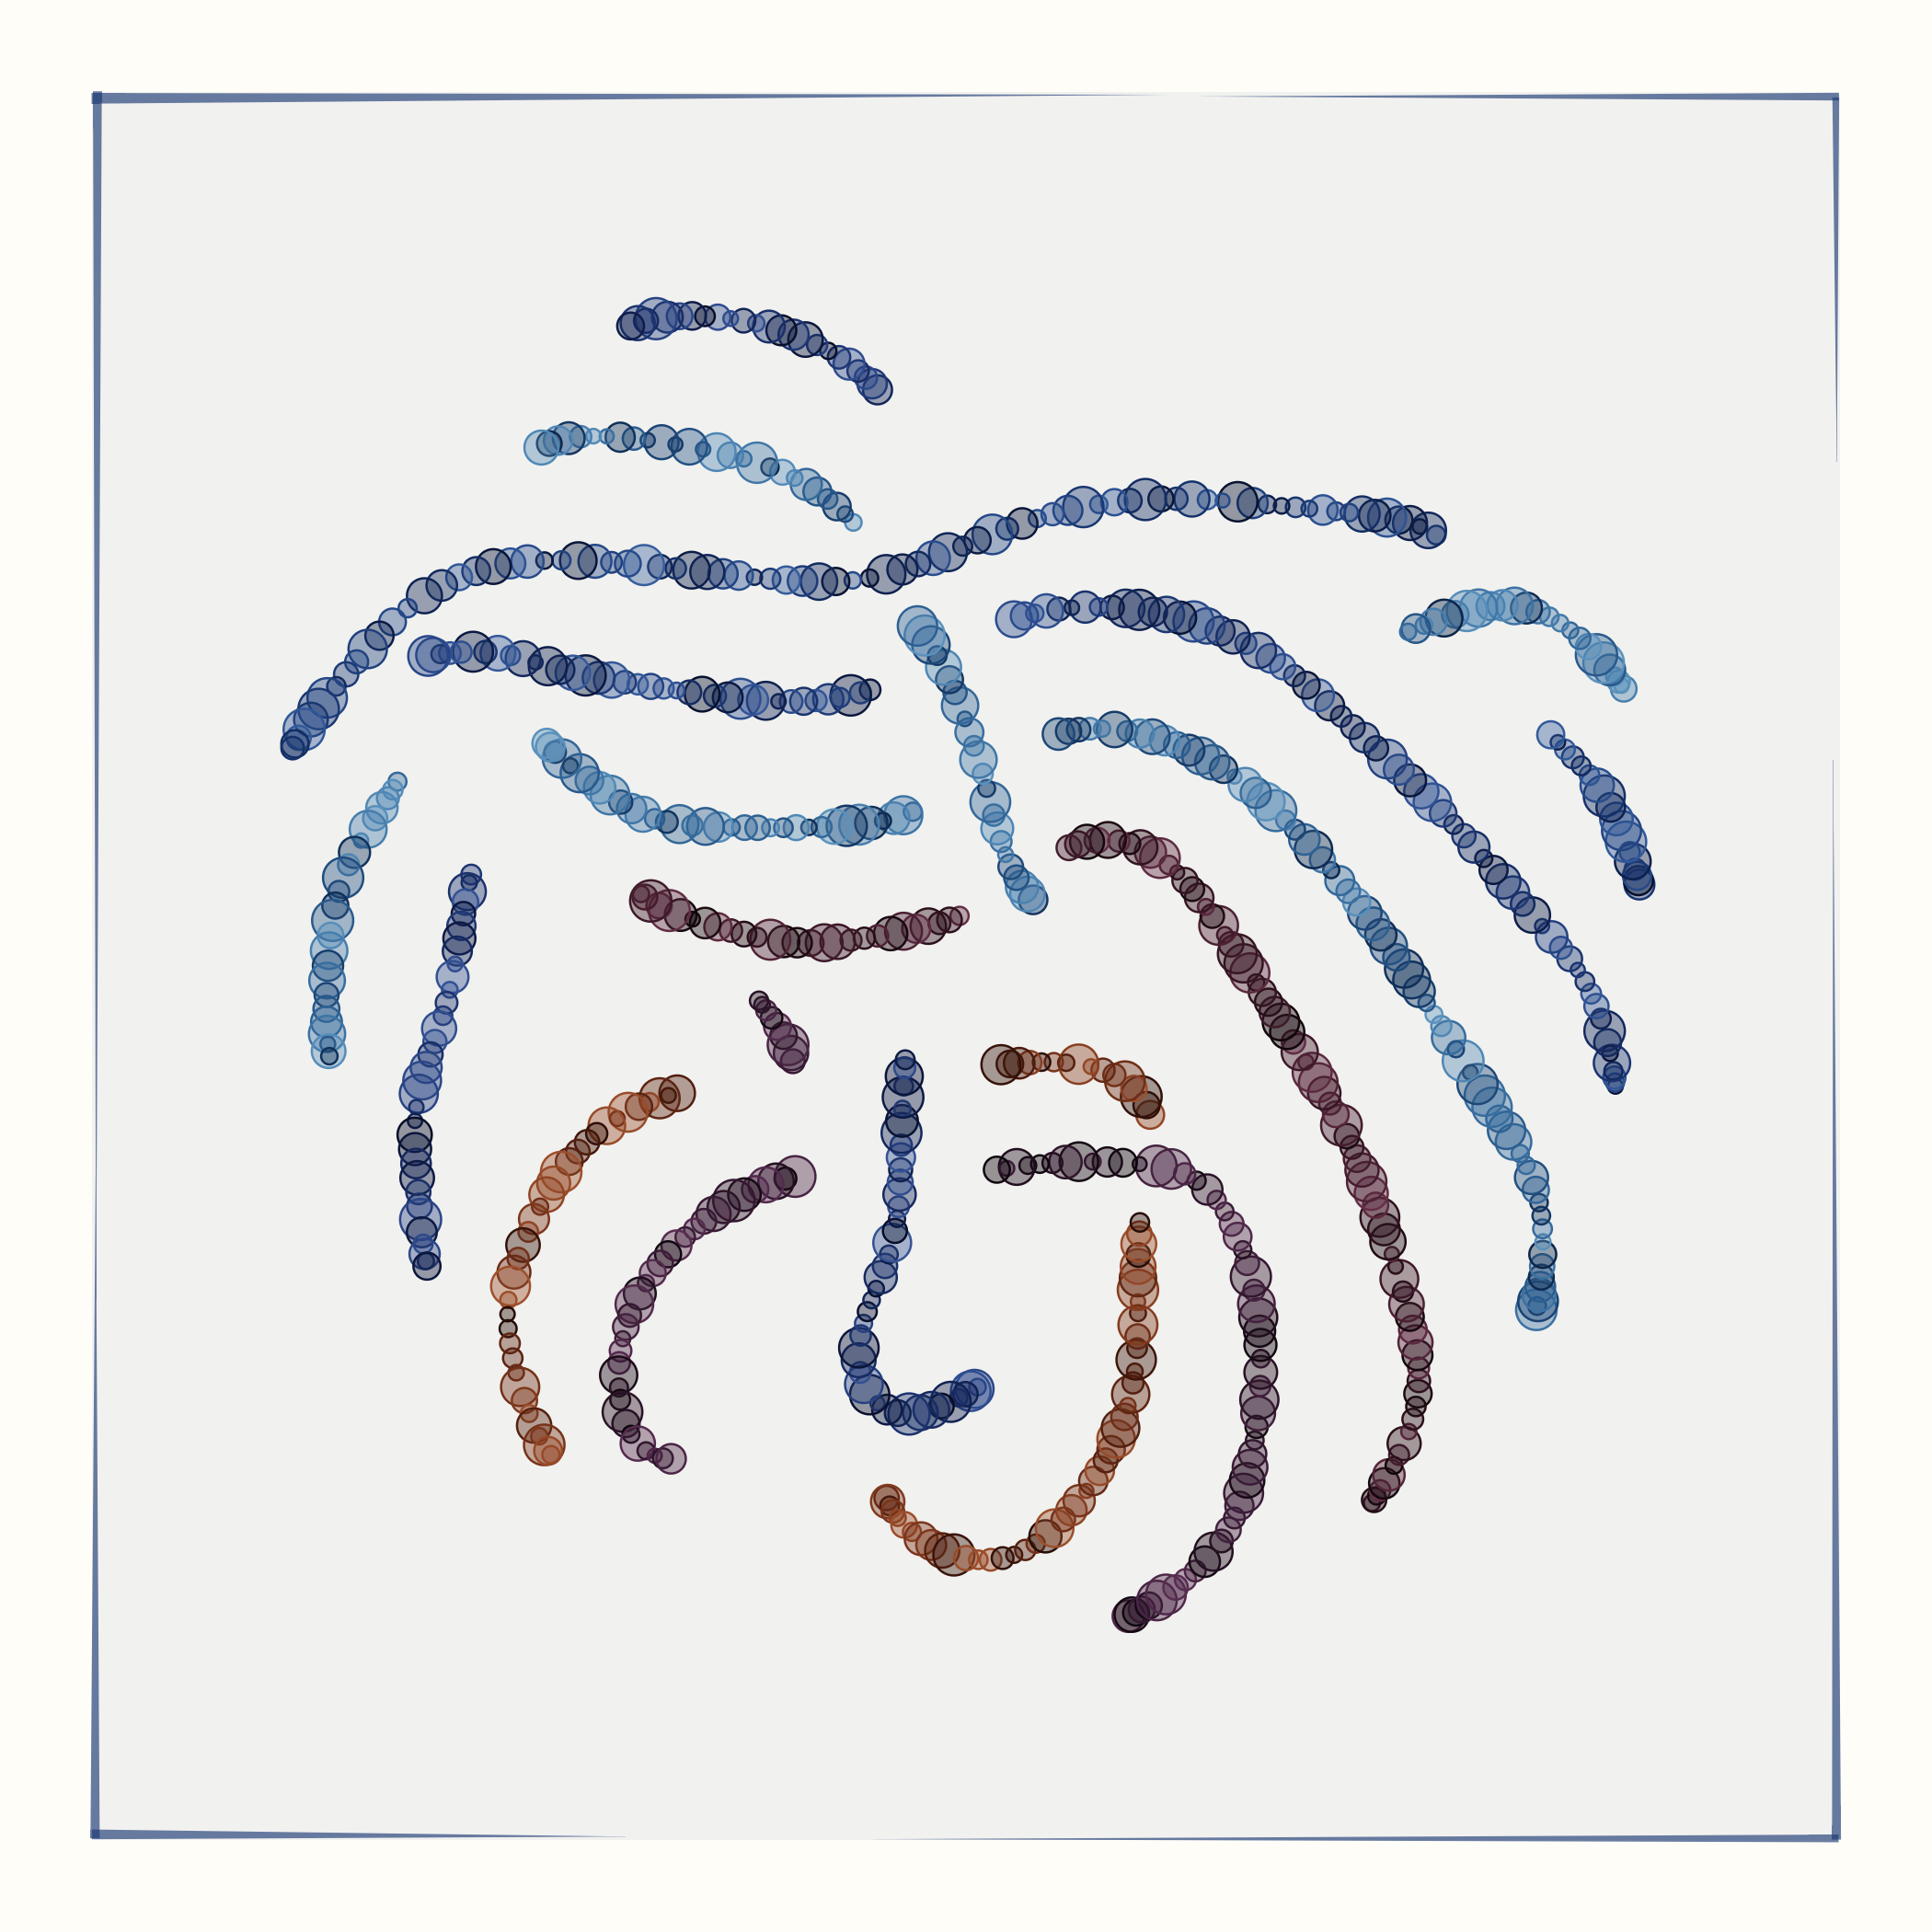
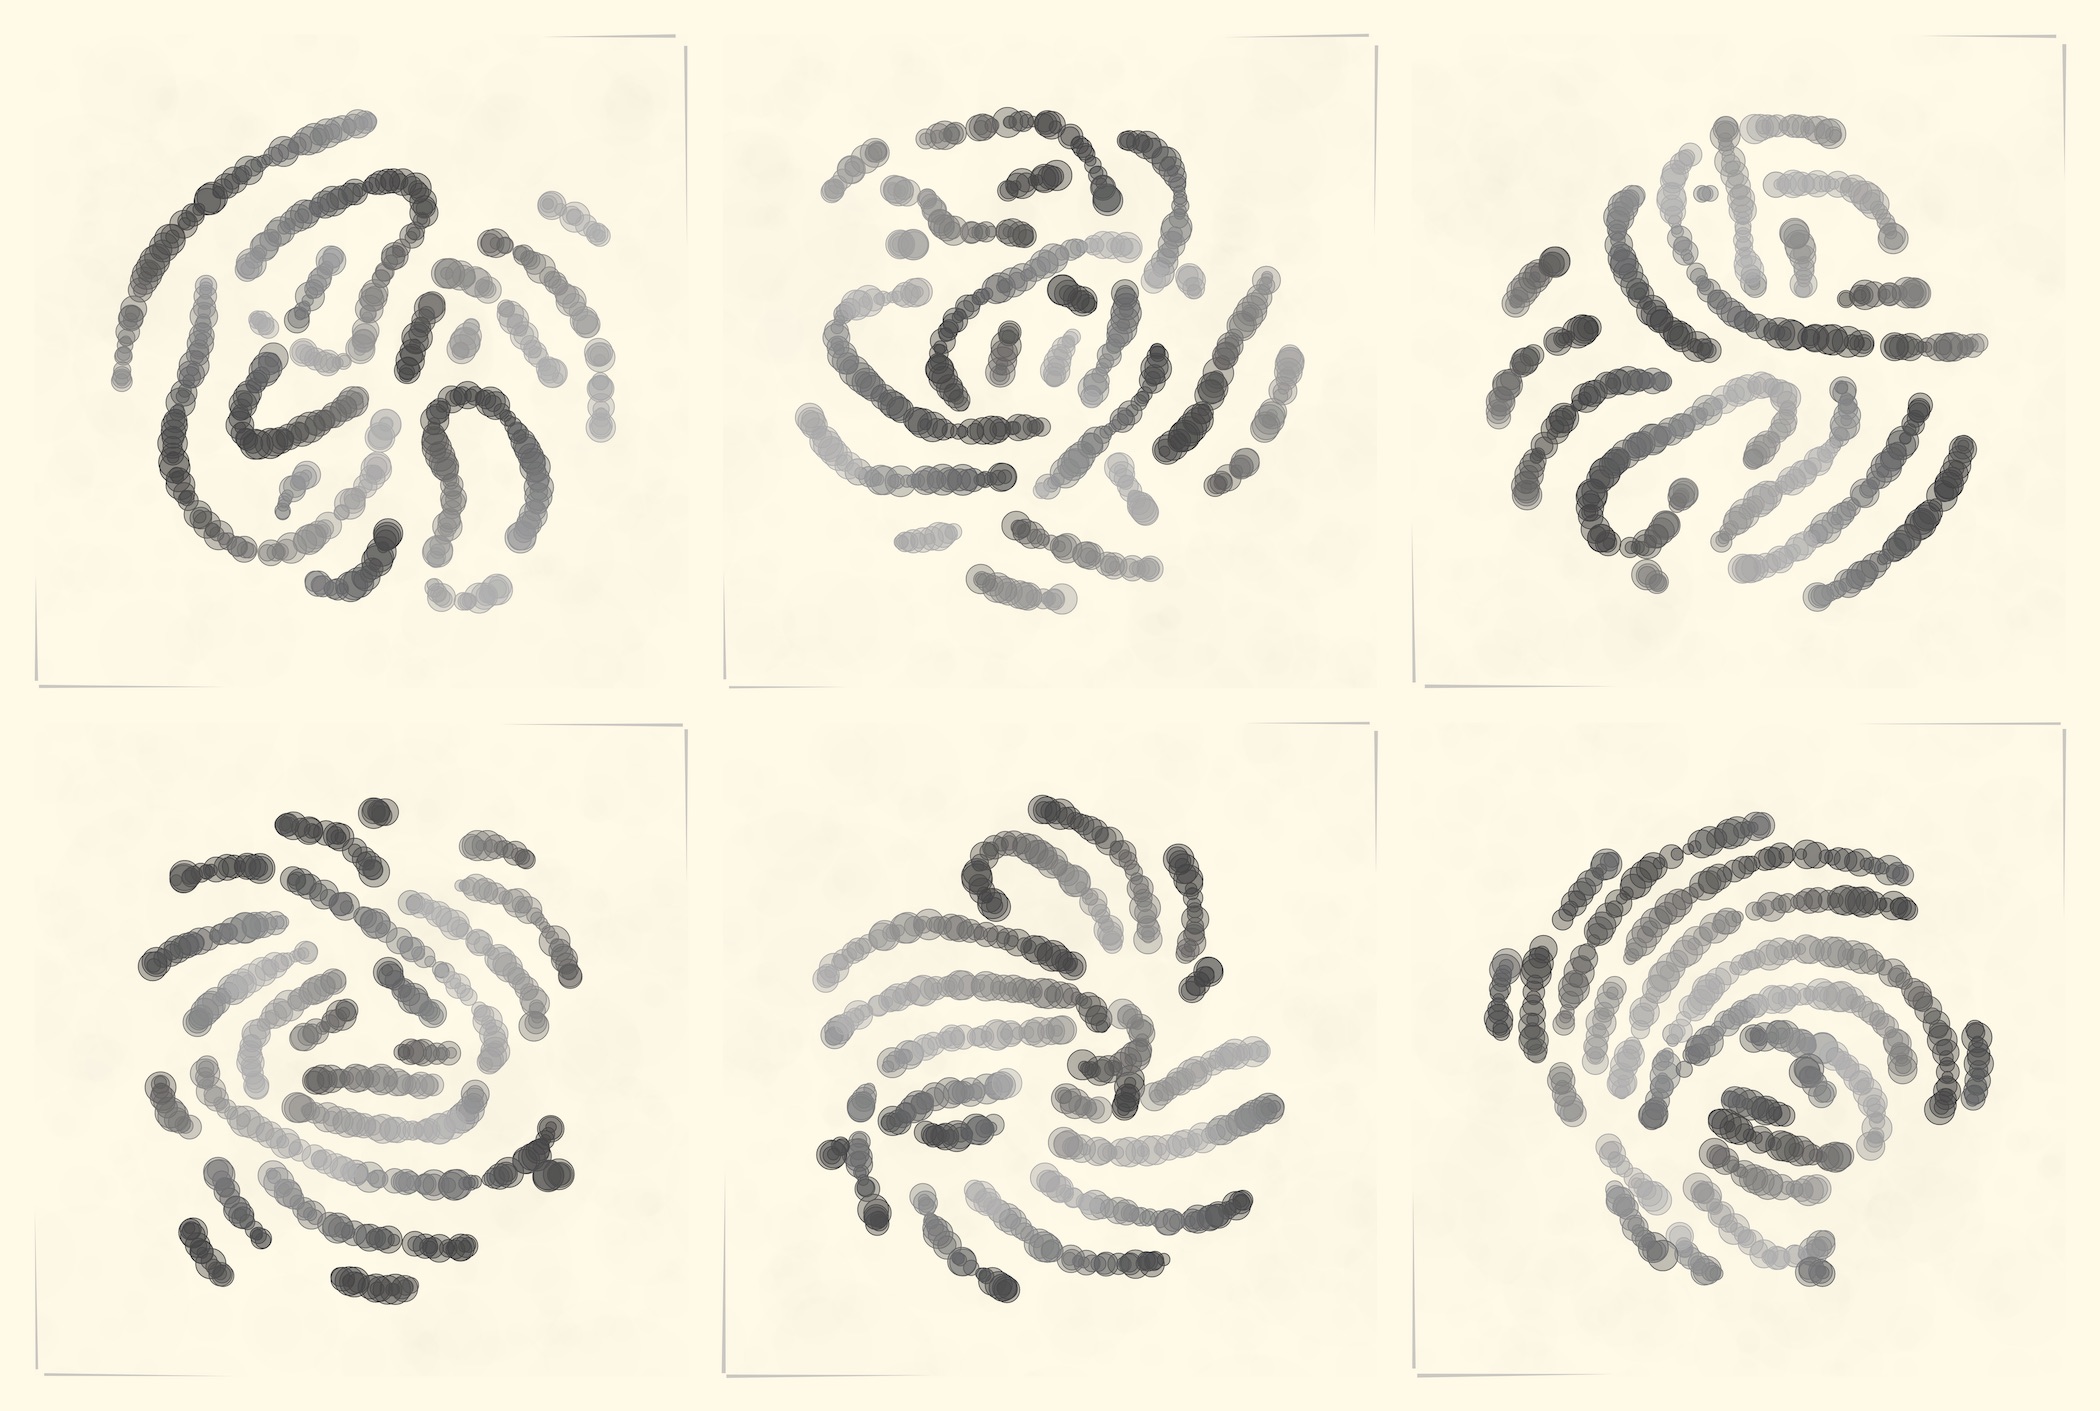
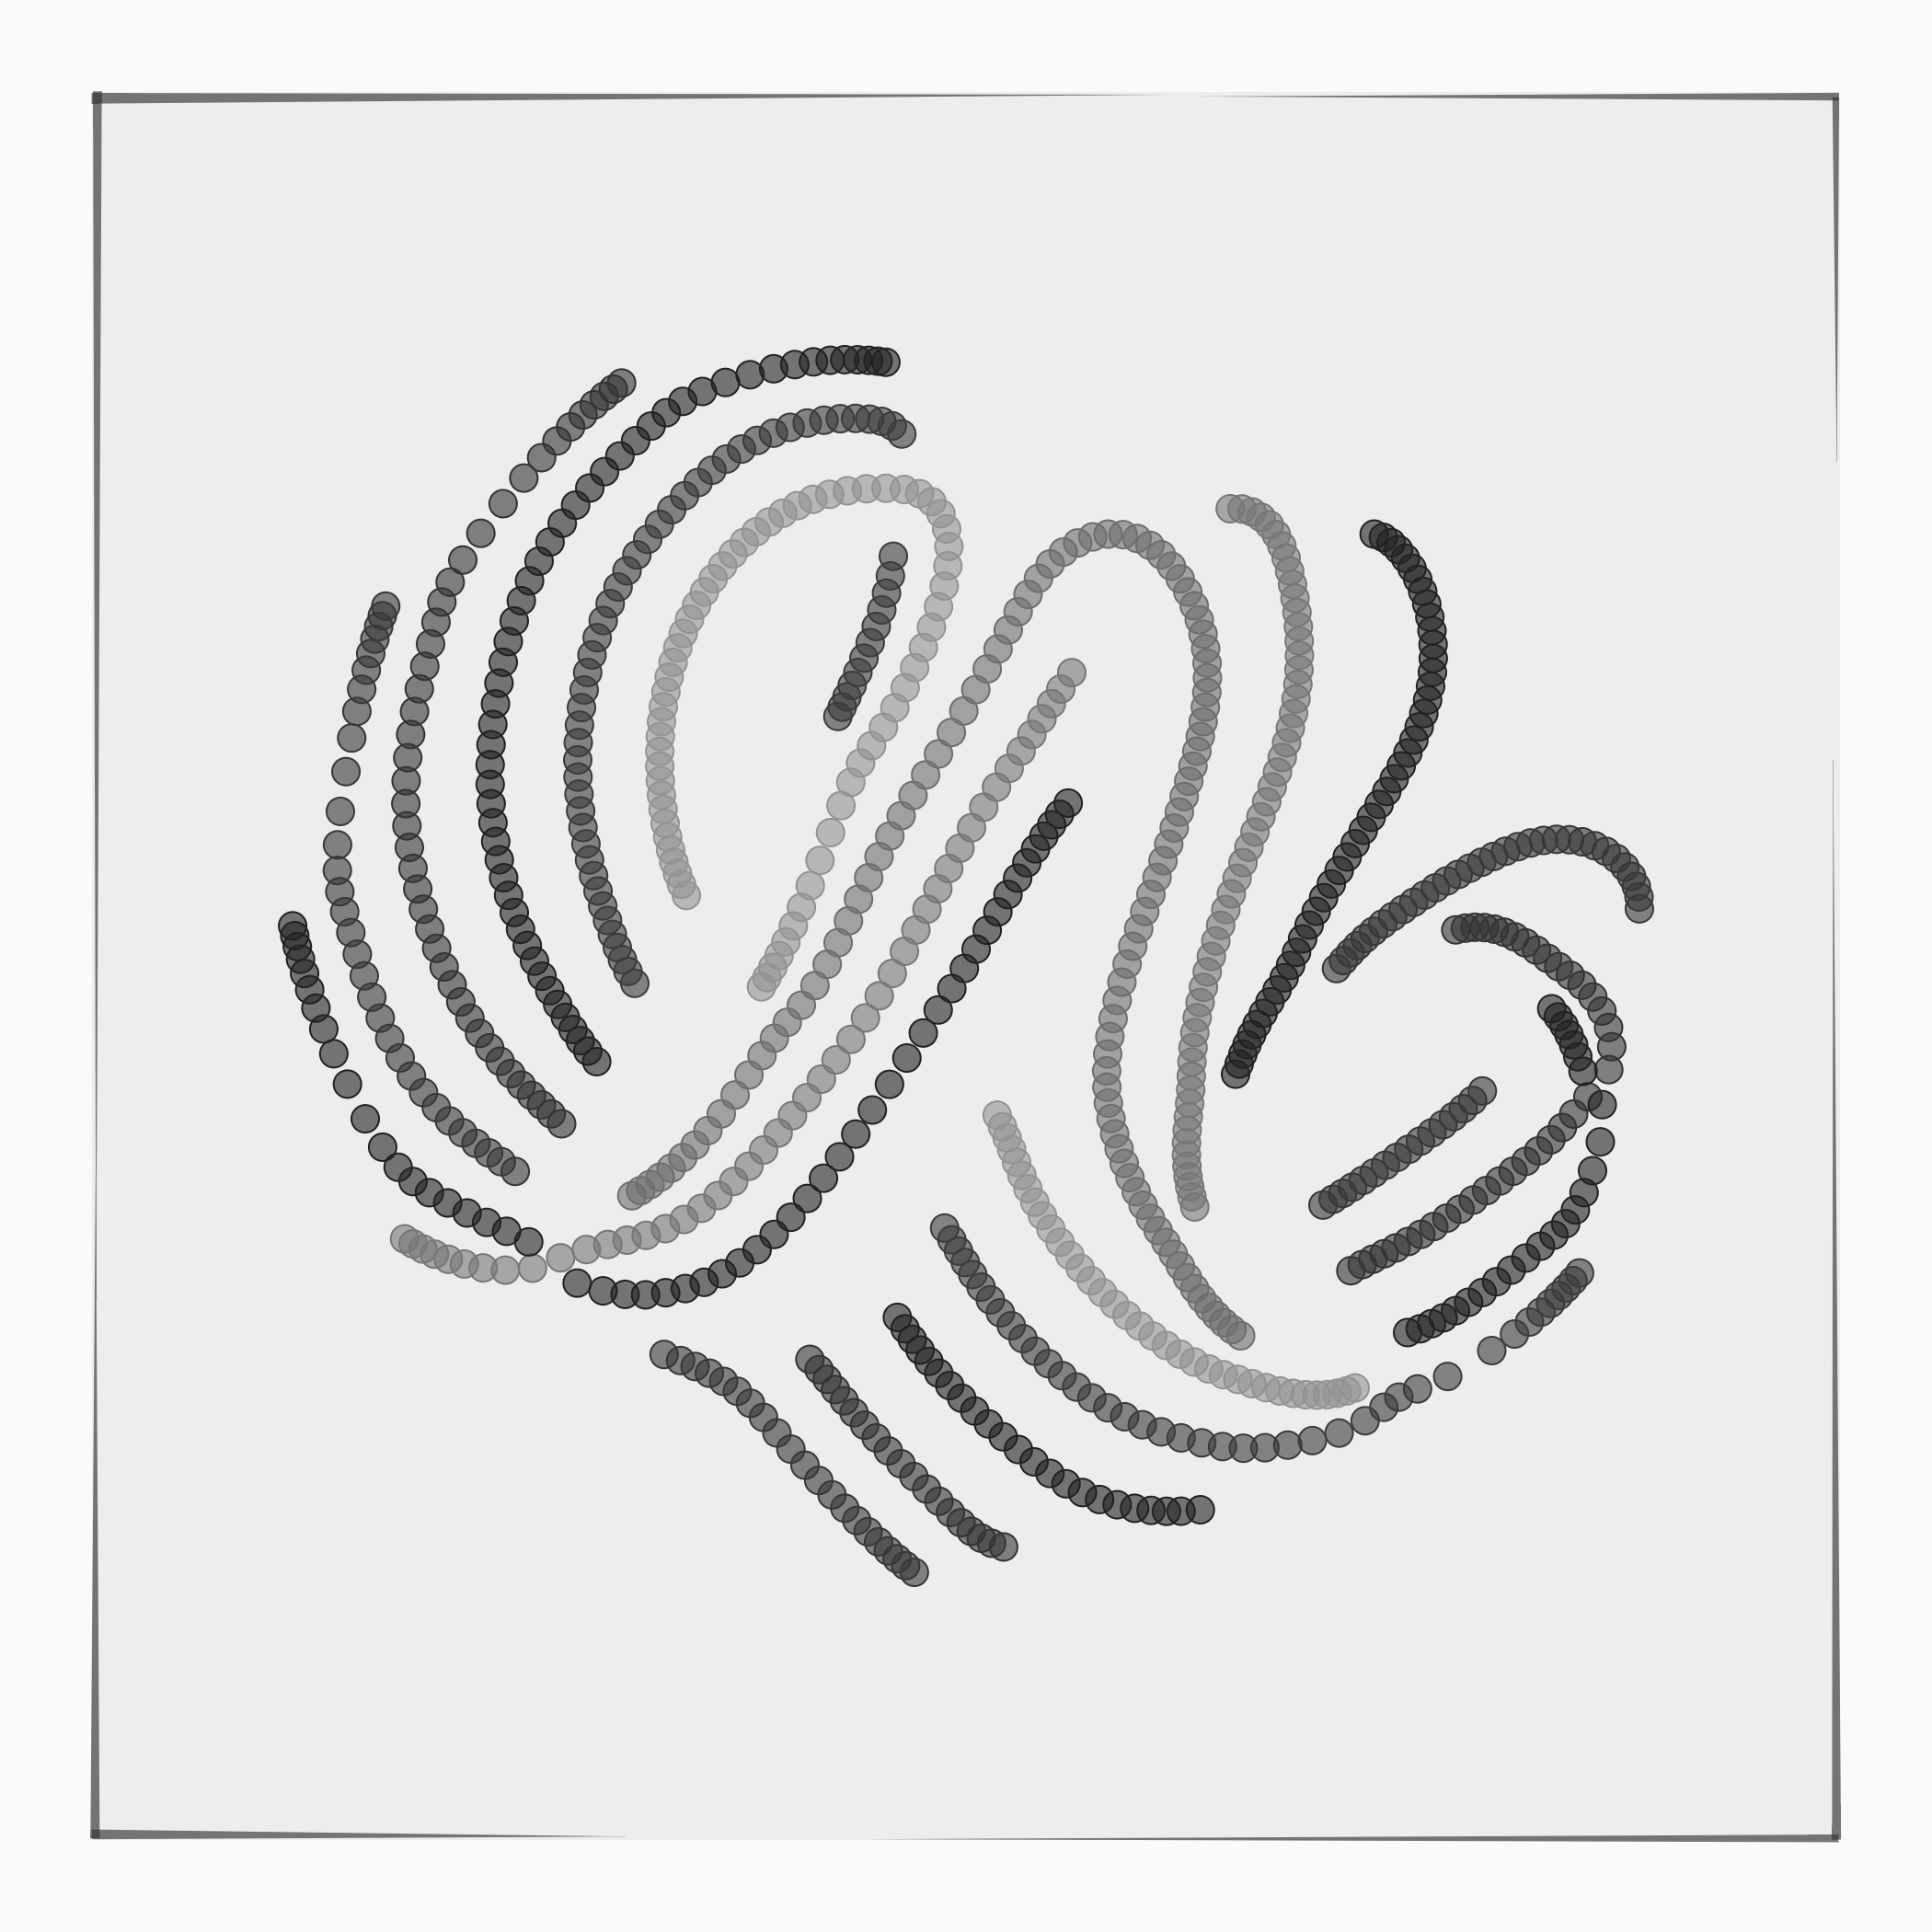
Numerous options affect the appearance and texture of points. First, by varying the width of the outline and the transparency of the fill of each point, I can create designs that appear strong or soft, or smooth, or rough. These effects are enhanced by applying some amount of jitter to point sizes or colors or both.

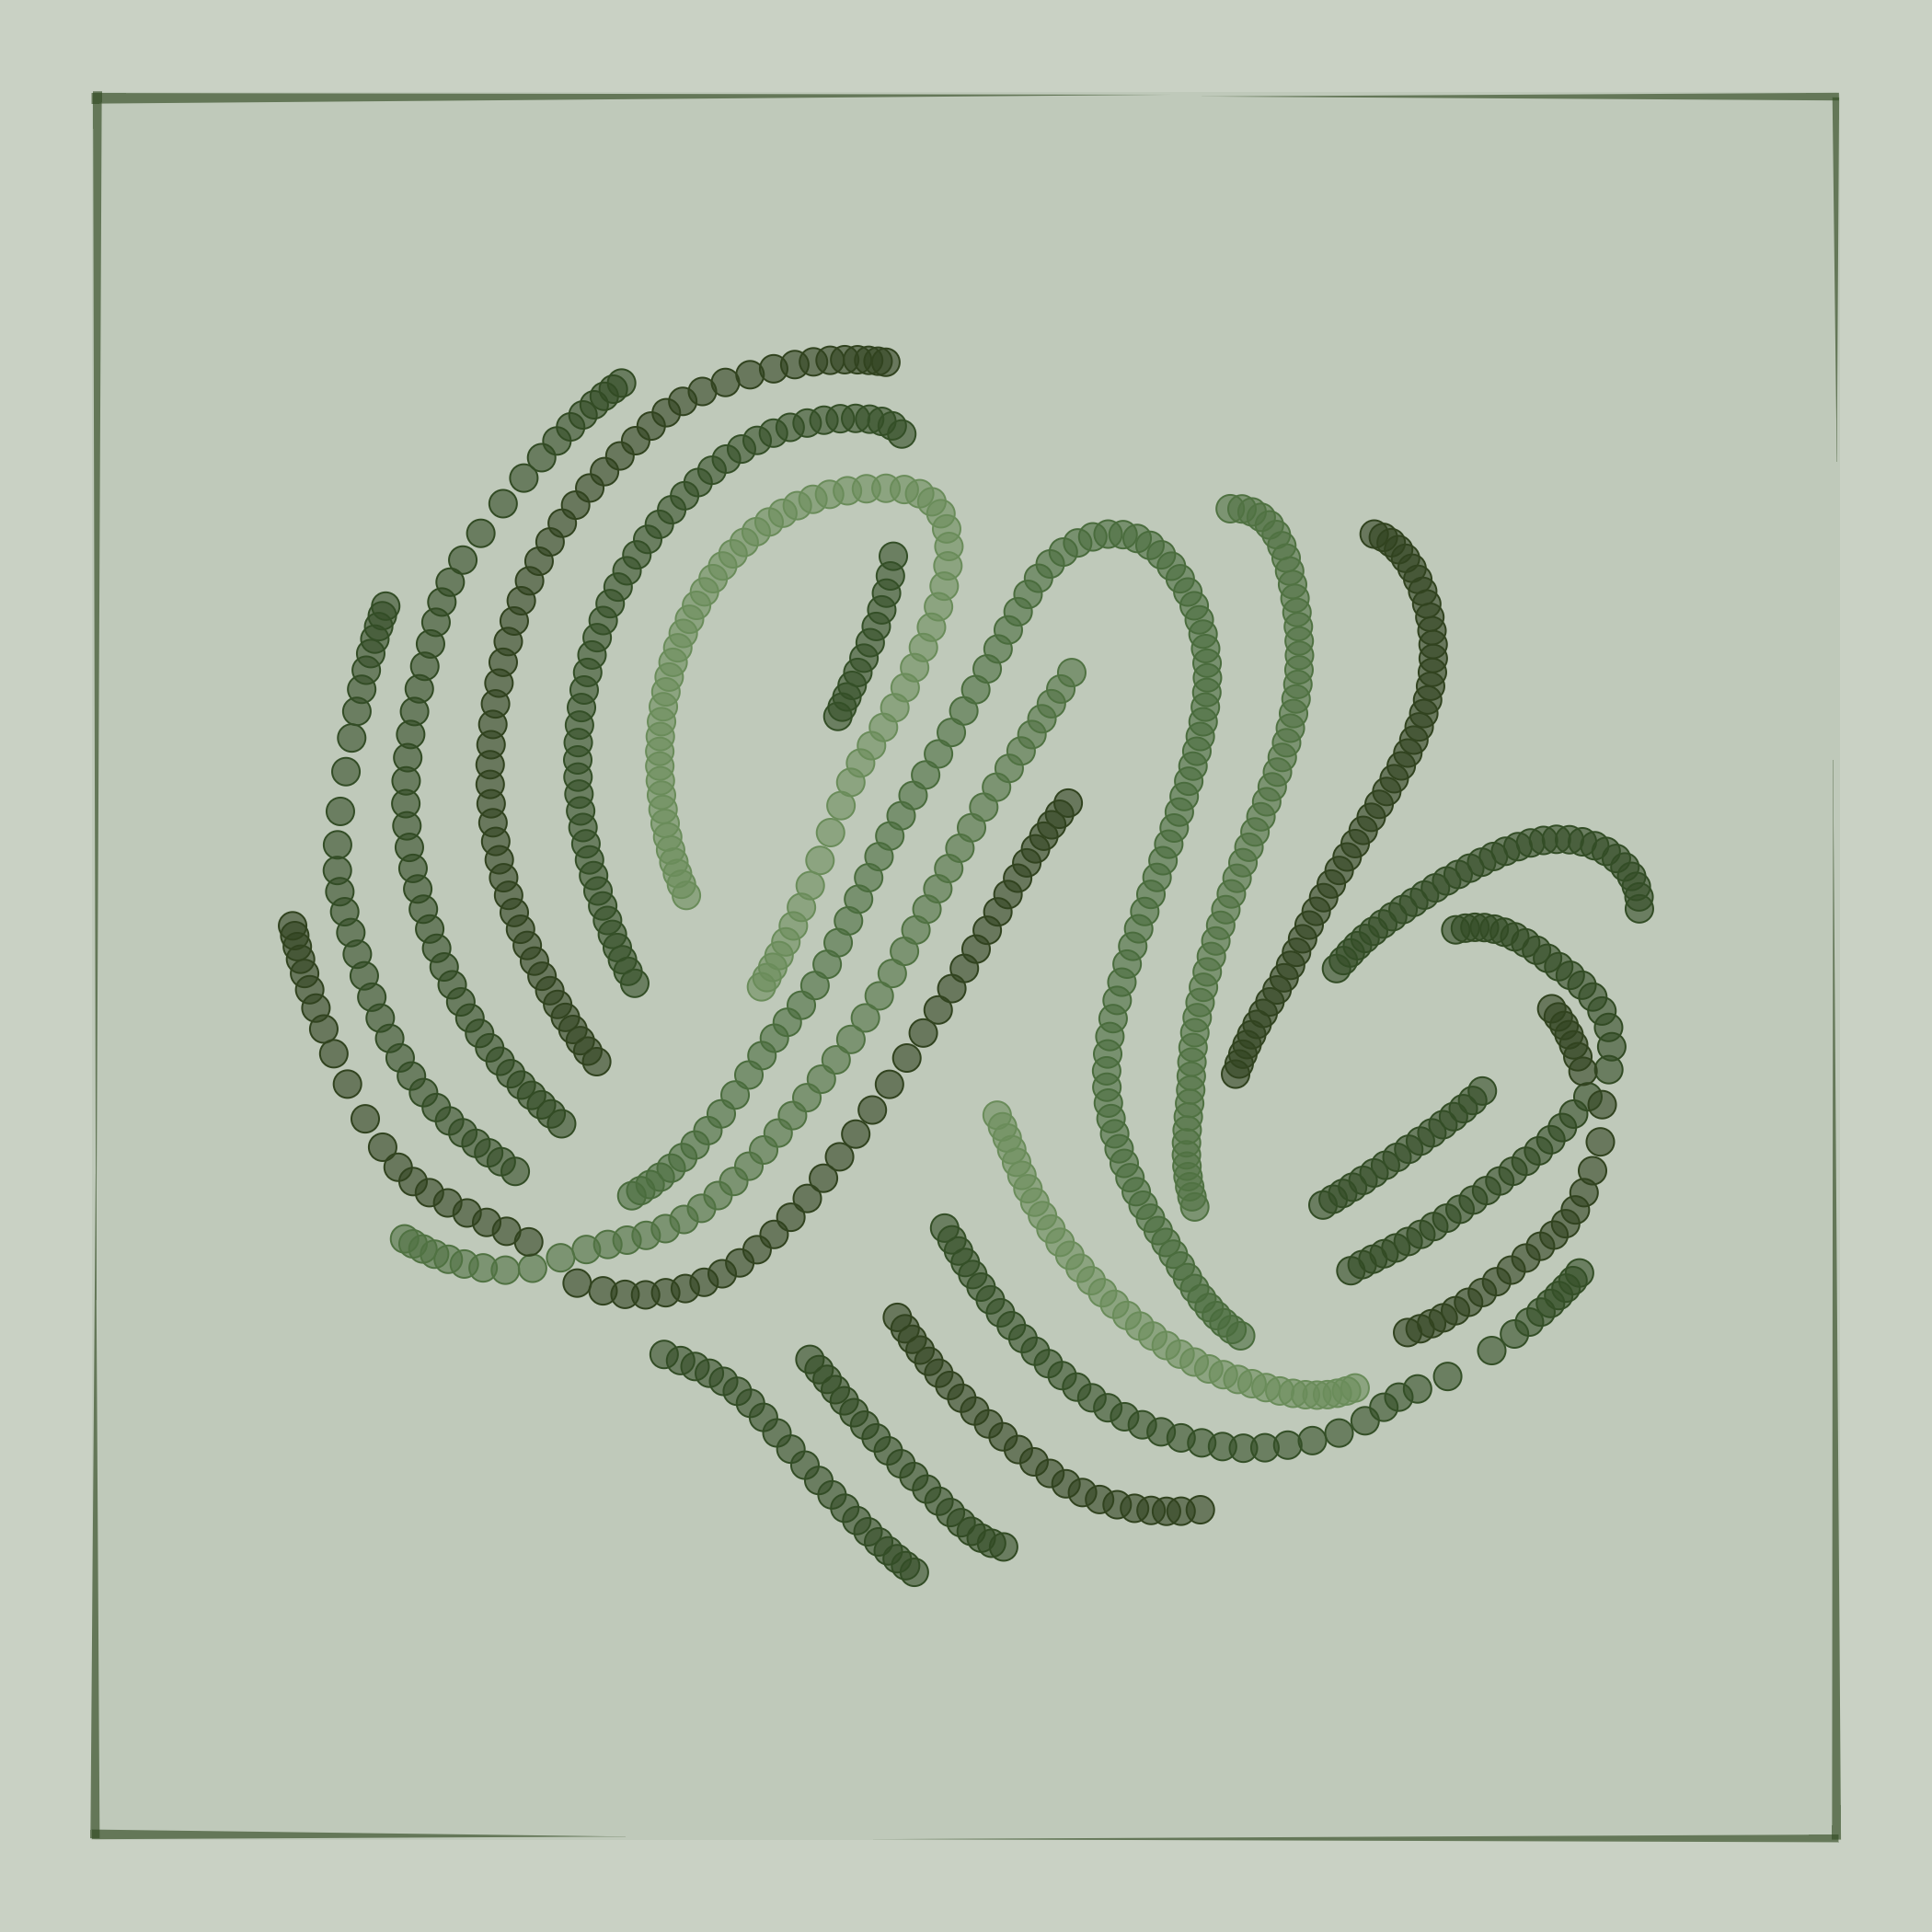


There are 20 distinct, manually chosen background colors, and each background color has up to 17 procedurally generated foreground palettes. Foreground palettes are generated using the trigonometric method popularized by Inigo Quilez. This method uses a handful of parameters and a trigonometric function to convert a continuously varying value (say, from 0 to 1) into an array of RGB values representing a color palette. I have modified the method here by taking the generated RGB values and subsequently correcting them using ACES filmic tone mapping to give the colors more depth and to avoid overly saturated and harsh colors.
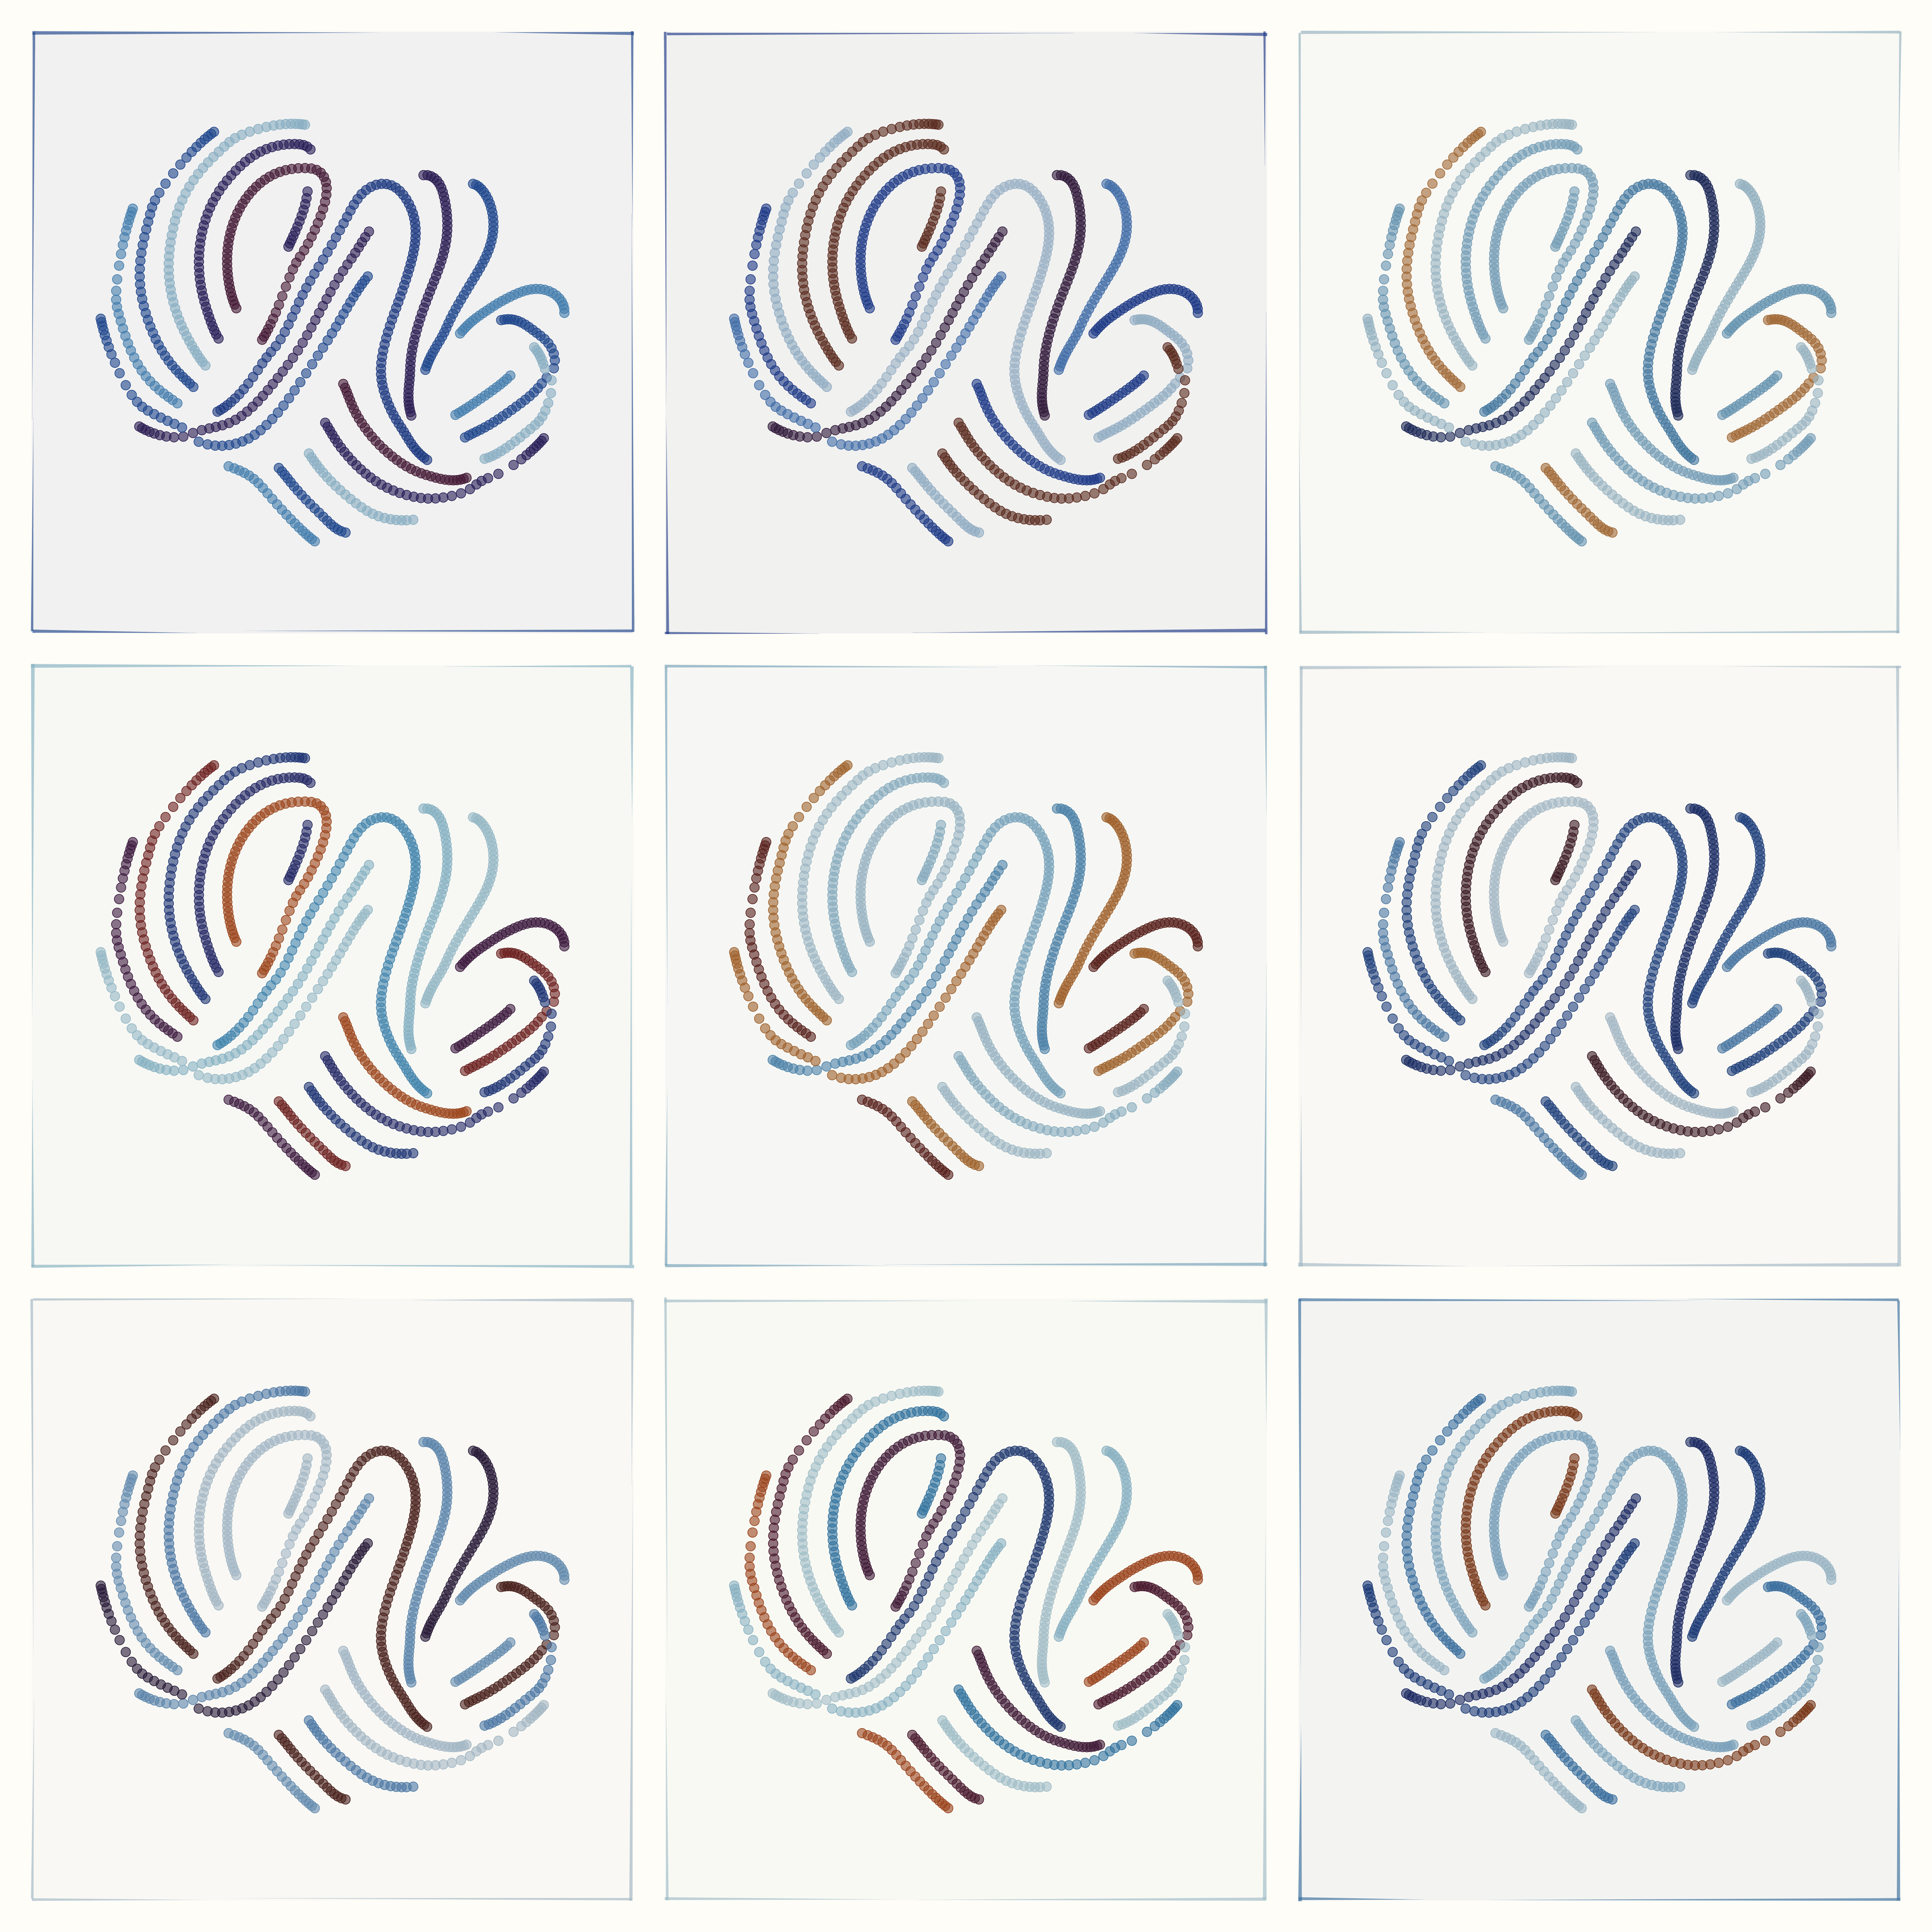
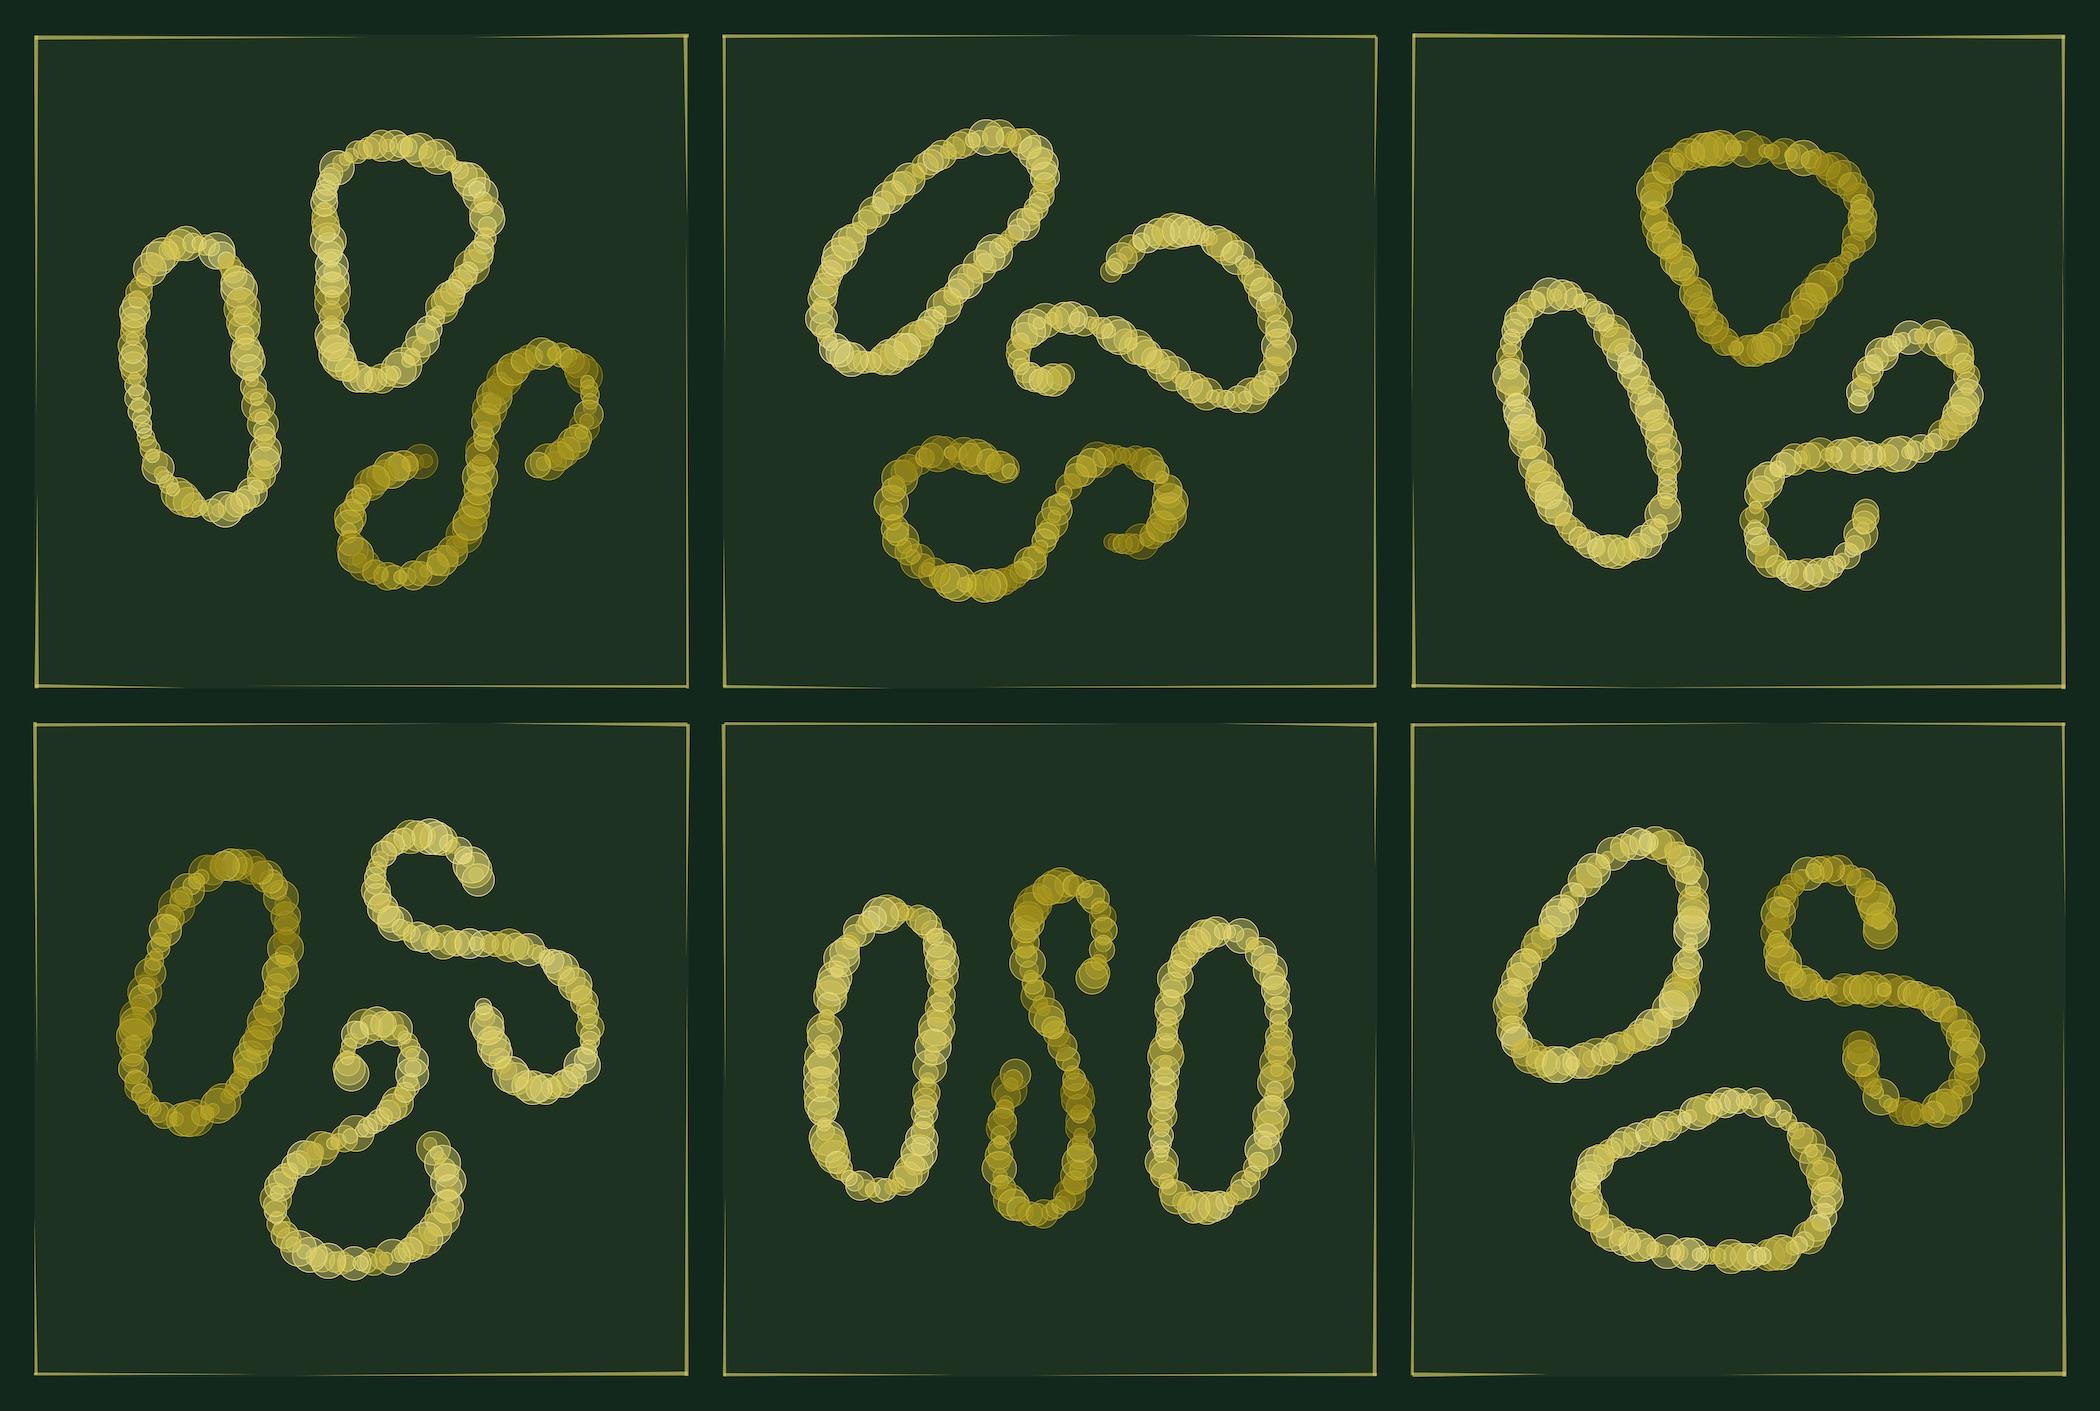
Each foreground palette is described by 12 parameter values, two of which control the amount of random variation in the palette. Nearly all palettes have some amount of random variation, which generally results in similar but not identical outputs for the same combination of background color and foreground palette. The image above shows nine different variations obtained from the same foreground palette paired with the same background color.

There are two distinct methods by which color is applied to data groups. In the regular method, all points corresponding to the same data group are assigned one randomly chosen color from the palette, so if there are three data groups the image has three distinct colors and if there are eight data groups the image has eight colors. In the inverted method, on the other hand, the entire palette is shown along all the points corresponding to one data group.
Implementation details
The main challenge with using t-SNE for generative art is that it is a fairly compute-intensive algorithm that typically requires highly optimized, compiled code to run well. This is not a problem when making 1/1 art, but for in-browser artworks such as the ones released on fx(hash), off-the-shelf t-SNE code does not work. In my prior collection Sneronoi (see code here), I implemented t-SNE in JavaScript and visualized the optimization process via an animation. The animation was hiding that the optimization was slow. But I didn’t like this approach, for two main reasons. First, I think art should be either static or animated, but not animated for a minute or two and then settle into a static image. Second, the animation would be way too slow for an artwork consisting of multiple panels.
I needed a faster version of t-SNE in the browser, and therefore I started to explore WebAssembly (WASM). WASM can potentially provide a nice performance increase over JavaScript. The simplest way to program in WASM is via AssemblyScript, which looks very similar to JavaScript but can be compiled into WASM. So I decided to take my JavaScript t-SNE code, convert to AssemblyScript, compile, and have great performance. Unfortunately this plan didn’t work.
It turns out a naive conversion of JavaScript code into AssemblyScript results in almost no performance gain. The JavaScript Just-In-Time compiler is amazing and doesn’t leave much performance on the table. The main remaining bottlenecks come from memory management and garbage collection, and those overheads exist in AssemblyScript just the same. To get more performance, we need to write code that avoids these overheads as much as possible. We can do this by working exclusively with static, flat arrays that are allocated once and are never freed or modified in size. So I completely rewrote the code following these principles, and then I had WASM code that ran about five times faster than the corresponding JavaScript code, and fast enough for this generative art series.
Apart from the WASM code implementing the t-SNE algorithm, all other code for this series is plain JavaScript with no external dependencies or third-party libraries. ACES tone mapping was implemented by taking code from the BakingLab project, written in HLSL, and converting it into JavaScript. The final artworks are generated as SVG files and can be downloaded and displayed at arbitrary resolution.