If I were king of the world, I would decree that every man or woman who releases a software product, for pay or for honor, with the purpose of graphing data, shall, upon pain of death, ensure that the default axis labels, axis tick labels, and legends are printed at a reasonable size, legible to your aging king’s declining eyesight. However, because I would be a fair and wise king, I would also decree that every such man or woman have a one-month grace period to bring their software into compliance. Without such a grace period, I’m afraid all authors of currently available graphing software would have to instantly lose their heads.
I have been in science for almost 20 years, and I have used and seen used a myriad of different graphing programs. When I was a grad student, gnuplot was all the rage. As a postdoc, I mostly used xmgrace. These days, I rarely make figures myself, but my students use everything from R with various plotting libraries, python with matplotlib, to MATLAB and even Mathematica. (As an aside, MATLAB and Mathematica, the commercial products, are both strong contenders for ugliest default graphics, by a wide margin. Apparently neither of the parent companies can afford to employ a graphical designer.) NONE of these programs use sane defaults for axis labels. They don’t use sane defaults for other things either, but this post is about axis labels.
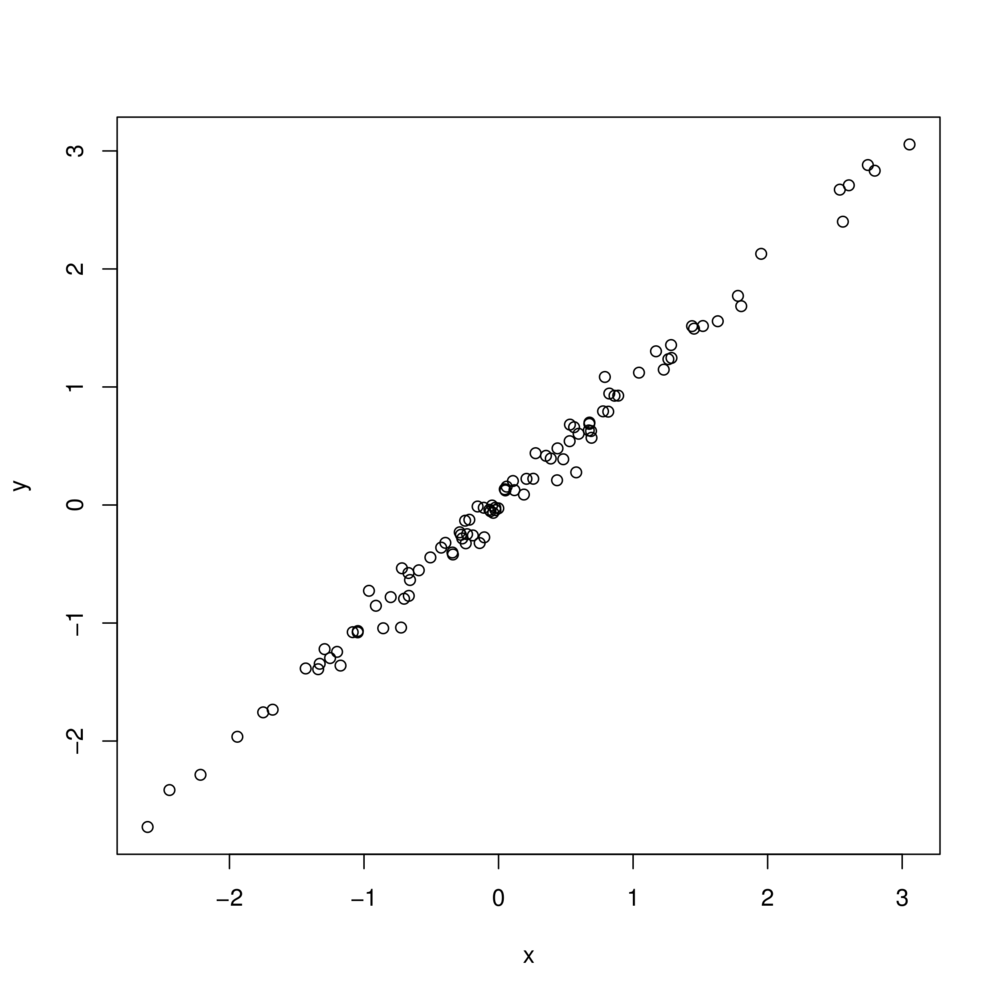
Figure 1: Scatter plot created in R, using the functions pdf() and plot() with default options.
Getting axis labels right shouldn’t be that hard. Figures usually appear in print at a width of about 3” to 5.5” (depending on whether they span one or two columns in a typical two-column layout). So, when you scale down the figure to that size, the font should be at a reasonable size, somewhere in the range of 10pt–12pt. Make it 9pt at 3” for your default settings, and you’ll never be terribly off. How hard can it be? Very hard, apparently. Try it out: Take your favorite plotting program, make a simple graph, say an x–y scatter plot using default settings, then scale the resulting figure to 3” and see if the labels are at a suitable size. If I do this in R, I get the result shown in Figure 1.
There’s more things that are wrong with this figure than just axis labels, but axis labels is what I’m focusing on here. Clearly they are too small. I bet you’ll get the same result in your favorite plotting program. By default, virtually all plotting programs I’m aware of make axis labels way too small.
So, what is going on here? First, I doubt that the people writing plotting software are experienced scientists who have prepared thousands of publication-quality figures. So maybe they just don’t know any better. Second, and more importantly, I believe the culprit is screen preview. Take the same figure, blow it up to a width of 20” on a modern, high-resolution monitor, and the axis labels look just fine. In fact, if you take a figure with properly sized axis labels and blow it up to 20”, the axis labels look outright scary. I can totally understand how somebody who has only ever looked at graphs on screen would feel uncomfortable making fonts bigger. Unfortunately, we the consumers of plotting software will generally have to produce figures to be used in print, and thus we have to scale the fonts to an appropriate size, even if it scares us. Apparently the authors of said software don’t have the guts to do so.