Abstract
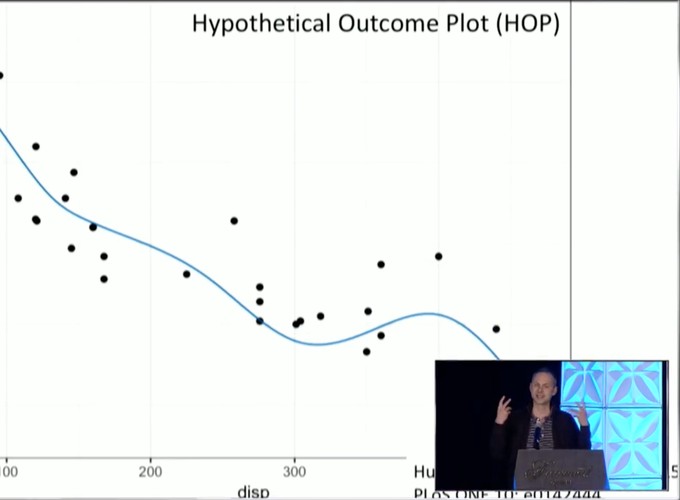
Uncertainty is a key component of statistical inference. However, uncertainty is not easy to convey effectively in data visualizations. For example, viewers have a tendency to interpret visualizations of the most likely outcome as the only possible one. Viewers may also misjudge the likelihood of different possible outcomes or the extent to which moderately rare outcomes may deviate from the expectation. One way in which we can help the viewer grasp the amount of uncertainty present in a dataset is by showing a variety of different possible modeling outcomes at once. For example, in a linear regression, we could plot a number of different regression lines with slopes and intercepts drawn from the range of likely values, as determined by the variation in the data. Such visualizations are called Hypothetical Outcomes Plots (HOPs). HOPs can be made in static form, showing the various hypothetical outcomes all at once, or preferably in an animated form, where the display cycles between the different hypothetical outcomes. With recent progress in ggplot2-based animation, via gganimate, as well as packages such as tidybayes that make it easy to generate hypothetical outcomes, we can easily produce animated HOPs in a few lines of R code. This presentation will cover the key concepts, packages, and techniques to generate such visualizations.