Abstract
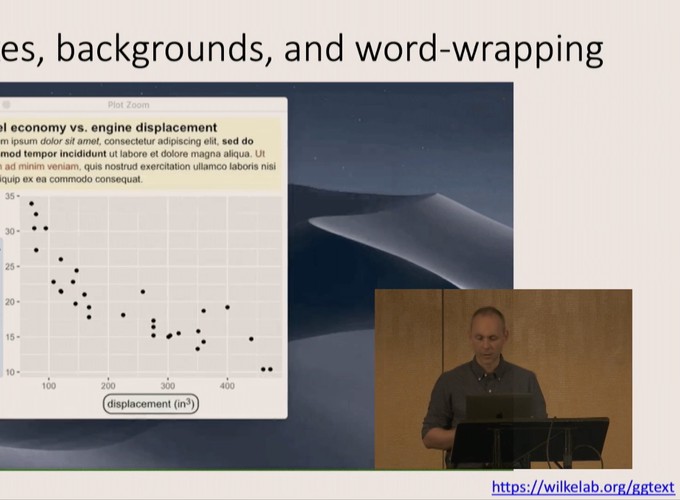
The ggtext package provides various functions to add formatted text to ggplot2 figures, both in the form of plot or axis labels and in the form of text labels or text boxes inside the plot panel. Text formatting can be achieved through a small subset of markdown, HTML, and CSS directives. Features currently supported include italics, bold, super- and sub-script, as well as changing font size, font family, and color. Basic support for adding images to formatted text is also available.
Date
Jan 30, 2020
1:23 PM
Event
Location
San Francisco, CA